
ABSTRACT
When a soil, rock or sediment is exposed to changes of its chemical environment, e.g. by infiltration of water, the new chemical composition propagates as a wave through the porous medium. The corresponding transport processes are described using concepts of equilibrium multicomponent ion chromatography with interaction (method of characteristics with hydrodynamic dispersion being neglected). The mathematical model is a system of n coupled quasilinear partial differential equations in one space dimension and time, n being the number of interacting chemical components. This model allows to quantify an interesting remobilization scenario for a deposit of trace contaminants adsorbed on soil particles: the contaminant inventory desorbing behind the front of a remobilizing wave will accumulate at the front if the velocity of the front is intermediate between the contaminant velocities upstream and downstream of the front. Oxide adsorbents (described by the Triple Layer Model) are used as examples in the computations.
The analysis suggests that the potential hazard associated with a contaminated soil or sediment cannot be derived from the contaminant adsorption isotherms alone. The additional data needed are the velocities of the possible waves.
Rather than presenting site specific transport simulations of accumulation scenarios, this paper will discuss which chemical factors lead to the development of accumulations.
The first part of this paper reviews one possible mechanism of accumulation of a trace M ("contaminant"), known in chromatography [Helfferich and Klein, 1970]. Here the terminology will be defined, and the description will use basic concepts and the language of multicomponent ion chromatography with interference [Hwang, Helfferich, and Leu, 1988]. The accumulation conditions will be stated in terms of distribution coefficients kd of M and a suitable secant of the isotherm of the remobilizing chemical f. These system properties can either be taken from empirical compilations or can be computed based on a suitable adsorption model.
In the central part of this paper ("Accumulation Potential") it is shown that once these simple system properties are known, one can decide whether or not a constant kd model (or a model assuming a stochastic kd distribution) may be used to compute contaminant transport, thus ignoring the possibility of accumulation. Contaminant kd's alone do not provide sufficient information to make that decision. Cation adsorption on oxide mineral surfaces will be used to illustrate this point.

where
Cti = Ci + ci is the total concentration of i, v0 is the velocity of the liquid and D is the coefficient of hydrodynamic dispersion. Influx of non soluble phases of i is not considered in (1). In this paper it will be assumed that the dispersive influx term is small compared to the advective one represented by the first term on the right hand side of (1). Disregarding the dispersive term, (1) reduces to
(2), a hyperbolic set of conservation laws

In the case of adsorption with an isotherm Ci = fi(c1, c2, ..., cn)

where the summation Σj is done over all chemical components j. This can be written in matrix form as

Here, C and c are vectors with components Ci and ci, respectively. Q(c) is the Jacobi matrix of the multicomponent isotherm C(c), with elements

In this notation the hyperbolic set of conservation laws (2) becomes
(3)

with I being the unit matrix. (In multicomponent chromatography and contaminant transport I + Q = R is called "retardation matrix".)
The set of quasilinear conservation laws (3) is hyperbolic, meaning that the inverse of the matrix (I + Q(c))/v0 has n real, distinct eigenvalues λj(c), (j = 1, n). Customarily, they are arranged in increasing order
A line in {x, t} space (Fig. 1) with slope λk(c) is called "k-characteristic at concentration c". It is the path in this space of a concentration vector c being a solution of (3) corresponding to the eigenvalue λk(c). This solution is called k-rarefaction wave, the name referring to the properties
Insert: Characteristics 1', 2', 3', 3", 4" are defined as
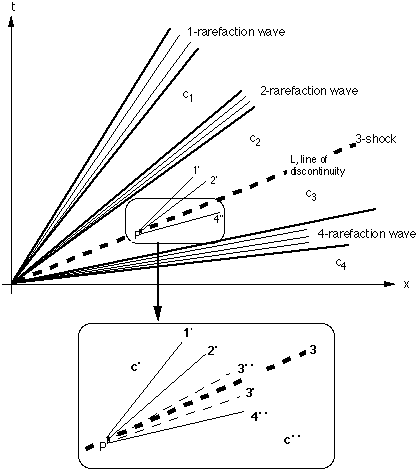
FIGURE 1: Schematic of the solution of hyperbolic system (2) with 4 components (vectors ci have 4 components: ci = {ci1, ci2, ci3, ci4}), represented in {x, t} space. System solution consists of 4 constant states, c1, c2, c3, c4 = c", the characteristics of which are the heavy lines. Constant states 1 through 3 are bounded by the 1-, 2-, and 4-rarefaction waves (heavy solid lines) and the 3-shock ("line of discontinuity, L", heavy, dashed). Rarefaction waves are pictured by a fan of some arbitrarily chosen characteristics (light lines), each representing the path of a concentration c within the wave.
There exist also piecewise smooth solutions of the system of conservation laws (2). Here the concentration changes by a finite amount rather than by differential amounts as it does across a rarefaction wave. Let P be a point on the line of discontinuity L and let c' and c" be the values of the solution on the left and right side of the discontinuity, respectively. Accordingly, the mass conservation law involves the differences
Δc = c' - c"
ΔC = C' - C"
rather than differentials ∂C and ∂c. For every component i we have a conservation law similar to (2)
(5)

After multiplying with Δx

we can solve for Δx/Δt = σk, the speed of the k-discontinuity:
(6)

In {x, t} space, σk is the slope of the line of the k-discontinuity. Equation (6), the so-called "Rankine-Hugoniot relation", has n physical (piecewise smooth) solutions. Any such solution is called a k-shock (also called "front", "self sharpening wave" or "migrating boundary") if it meets the following "entropy" conditions (from Greek εντρεπειν (entrepein) = to turn -or run- into) [Lax, 1957]:
λk-1(c') ≤ σk ≤ λk+1(c"), (k = fixed, in our example: k = 3).
Because the λs are arranged in increasing order this implies
λ1(c') ≤ λ2(c') ≤ ... λk-1(c') ≤ σk ≤ λk+1(c") ≤ ... ≤ λn(c")
or in our example:
λ1(c') ≤ λ2(c') ≤ σ3 ≤ λ4(c").
Condition (7) makes sure that the k-wave "breaks", meaning that it resembles a water wave breaking on its path onto the shore, its top running faster than its bottom part. The physics of concentration waves (c ≥ 0) allows this breaking process to proceed only until all parts of the wave have arrived at the same line. At this line the concentration jumps from ck-1 to ck (in our example from c2 to c3). This concentration jump Δc = ck-1 - ck is the k-shock.
In chromatography [Helfferich and Klein, 1970, Charbeneau, 1988] it is customary to use the matrices I + Q(c) instead of the above mentioned inverse (I + Q(c))-1 referred to in gas dynamics.
The eigenvalues
λj(c) = v0/(1 + kdj(c)) = v0/Rj(c),
thus
(10)
kdj(c) = v0/λj(c) - 1.
The retardation ρk of a k-shock is defined analogously to (9)
(11)
σk(c) = v0/ρk(c).
The Rankine Hugoniot condition (6) tells us that the retardation of the k-shock is
(12')
ρk = 1 + ΔC/Δc.
where C is any component Ci of the vector C and c is any component ci of the vector c. (In a k-shock ΔC1/Δc1 = ΔC2/Δc2 = ... ΔCn/Δcn)
In the rest of this chapter we will apply the theory to show how a contaminant will accumulate during migration.
The retardation of this shock is
ρf = 1 + ΔCf/Δcf.
Because the concentration cM of the contaminant M is small, trace M moves on the background of the natural components and f, without being able to influence the chemistry of the background. Its speed is approximated by λM given in (9) with the vector c in kd(c) not containing the concentration cM:
(9')
λM(c) = v0/(1 + kdM(c)),
c = {c1, ..., cM-1, cM+1, ..., cn}
Condition (7) for the contaminant is
(14)
kdM(c') ≤ ΔCf/Δcf = kdf ≤ kdM(c").
This means: An observer located at P on the remobilizing shock will see species M coming towards her both from upstream and downstream locations. The front carries the inventory of the remobilized contaminant with it. The degree of accumulation can be calculated [Gruber, 1984].
The following limiting case of this situation is interesting as well: The remobilizing front moves without retardation (σf = v0 = λM(c') or kdf(c') = ΔCf/Δcf = kdf = kdM(c') = 0):
(15)
0 = kdM(c') = kdf(c') ≤ kdM(c").
The contaminant is remobilized by the moving front but cannot travel across the front. Thus, the remobilized contaminant inventory will stay in solution.
Whenever (14) or (15) is met, the decrease of the distribution coefficient (14) must not be disregarded, and transport models based on the assumption of a constant kd or a spectrum of stochastic kd 's are inappropriate. In that case the transport model has to contain a chemical adsorption model. Any of the chemical models meeting that requirement can be chosen, if it is used within the composition space in which it has been calibrated.
S-OH + M++ + H2O = S-OMOH + 2H+.
Consistent with the assumption of M being a trace element, only mononuclear surface complexes of M need to be considered. The concentration of a surface complex s containing M, CM,s, is then expressed as the product of a side reaction coefficient, σs, and the free concentration of the adsorbing ion, [M++ ], (definition of σs ):
(17)
CM,s = σs[M++ ].
Similarly, the concentration of a soluble complex mononuclear in M, [Ql], is the product of a corresponding side reaction coefficient, σl, and [M++ ]. This coefficient is a function of the concentration of a background element L that forms a soluble complex with M:
(18)
[Ql] = cM,l = σl(L) [M++ ].
The major chemical components of the system are also subject to adsorption and complexation but without restriction to mononuclear reactions. The appendix gives the sources of the data considered in the following examples.
Above pH = 7 adsorption of the divalent transition elements Pb, Cd, Cu, Zn, Ni and of UO2++ on a metal oxide can be represented by one single surface complexation reaction of type (16) [Hohl and Stumm, 1976; Vuceta, 1976, James and MacNaughton, 1977; Benjamin, 1978; Davis and Leckie, 1978; Richter, 1978; Balistrieri and Murray, 1979, 1981, 1982; Altmann, 1984; Tripathi, 1984]. The corresponding adsorption side reaction coefficient is
(19)

where {H+} is the activity of the proton in solution. Because of its surface charge, the oxide is surrounded by an electrostatic potential field, Ψ. The exponential term in (19) takes account of the work necessary to assemble the surface complex. There are two major adsorbing locations on the surface, the 0-plane (the surface itself), which loses one proton upon adsorption of one M, and the β-plane (located at some distance from the surface), which receives the (single) positive charge of the MOH complex. e, Ψ0 and Ψβ are the charge of the electron and the values of the electrostatic potential in the 0- and β-plane, respectively. K is the equilibrium surface complex formation constant. kT is the product of the Boltzmann constant and the absolute temperature of the system. With
(20)
CM = σs [M++ ]
and Σl meaning the summation over l, the soluble complexes of M and
(21)
cM = (1 + Σl σl ) [M++ ]
the distribution coefficient of M can be rewritten as a ratio of the side reaction coefficients:
(22)

Combining (22) with (19) gives the final expression for kd of M:
(23, Triple Layer Model)

Major processes and environmental variables influencing kd are now represented by individual terms in (23):
Sr = [S-OH] + Σl [S-Xl] + σs [M++].
Sr = ns f v ρ (1 - Φ) = 0.1 moles/liter.
where ns is the number of sites per unit area of the oxide. To simplify the discussion ns = 10-5 moles/m2 is used for all oxides in Fig. 2, because the variation of Sr due to the variation of ns [James and Parks, 1982] is small compared to the variability of the other terms in (23). f is the fraction of the soil particle covered with the oxide (0.2 is assumed). v is the surface to weight ratio of the soil particle (30 m2/g is assumed). ρ is the density of the soil particle (2.6 g/cm3 assumed) and Φ is the average volumetric water content of the porous medium (to simplify notation, Φ = 1 was used in chapter "Mechanism of Accumulation"). Sr = 0.1 moles/liter is consistent with the estimate used by Anderson [1979].
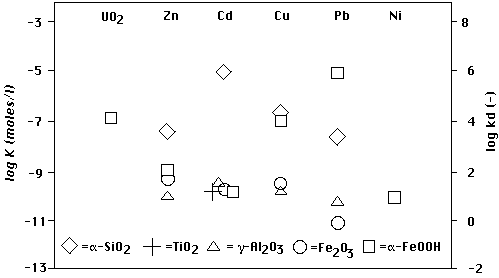
FIGURE 2. Distribution coefficients (kd, right ordinate, (-) means dimensionless) calculated from adsorption constants (K, left ordinate) for 6 divalent cations and 5 oxide adsorbents ("contaminants M"). Data and assumptions (see (23)):
The retardation of the contaminant M is (1 + kd) (see (9')). One can see that for the majority of cations M and adsorbents the retardations range between 1 and 100.
Accumulation of M occurs when a remobilizing agent shifts the corresponding symbol in Fig. 2 from its pre-remobilization position kd" = kdM(c") (e.g. the one used in the figure) down to a position kd' = kdM(c'). According to (14) the kd of the shock kdf = ΔC f/Δc f is intermediate between kd' and kd". So for the majority of cations M and adsorbents in Fig. 2 retardations of shocks range between 1 and 100:
1 ≤ ρf ≤ 100.
The remainder of this chapter will show that such shifts of the symbol locations in Fig. 2 are well possible (processes (a) - (d)). The element nickel is chosen as a representative example (because (16) describes adsorption in the pH range of interest, 4 <= pH <= 10 [Richter, 1978]). The computer code used is MINEQL-SGMA (Stanford Generalized Model of Adsorption), a computerized version of the surface complexation model [Davis, James and Leckie, 1978; Davis and Leckie, 1978].
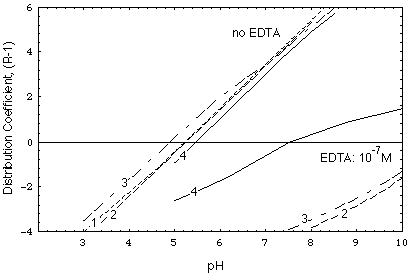
FIGURE 3. Distribution coefficient of nickel, calculated as a function of pH and major ion concentrations. Numbers on curves indicate composition of water, as explained in Tab. 1. The other data used in the computations are given in the appendix. See also Fig. 1 in [Gruber, 1988].
In detail:
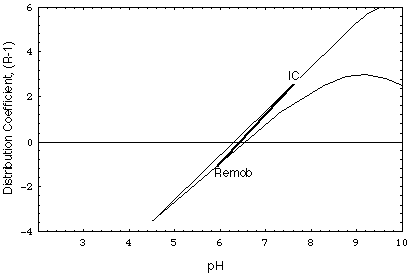
FIGURE 4.Distribution coefficient of nickel, calculated as a function of pH for the major ion concentrations of the undisturbed environment (curve IC) and of the remobilizing water (curve Remob) in Fig. 5 and 6.
Finally, also the model parameter K and the exponent of {H+} in (19) vary slightly with changing environmental conditions ("residual variation") [Benjamin, 1978; Honeyman, 1984; Altmann, 1984].
TABLE 1. (Negative logarithm of) Total concentrations of major ions (moles/l) used in computations of Figs. 3 - 6. Total concentration of adsorbing sites is 0.25 moles/l except for Figs. 4 and 6, where it is 0.0025 moles/l. Total concentration of Ni is 10-8 moles/l, except in Fig. 5 (intruding water), where it is 3.8 x 10⁻¹⁰ moles/l.
| Figure | Ca | Na | CO3 | Cl | SO4 | pH |
| 3 and 4 (curves 1, Remob) | 2 | 6 | 6 | 2 | 6 | - |
| 3 and 4 (curves 2, IC) | 6 | 6 | 6 | 6 | 6 | - |
| 3 (curve 3) | 6 | 2 | 6 | 2 | 2 | - |
| 3 (curve 4) | * | 6 | * | 6 | 2 | - |
| 5 (intruding water) | 6 | 6 | 6 | 6 | 6 | 4 |
| 5 (undisturbed environment) | # | 2 | # | 2 | 3 | 7 |
| 6 (intruding water) | 2 | 6 | 6 | 2 | 6 | 8 |
| 6 (undisturbed environment) | 6 | 6 | 6 | 6 | 6 | 8 |
Based on the preceding quantitative discussion of processes (a) - (d) one can expect critical kd shifts in Fig. 2 (i.e. the ones necessary to meet accumulation conditions (14)) even in the case of a poorly retarded front (ΔC f/Δc f = kdf (appr.=) 0). The deposits on γ-Al2O3 and amorphous Fe2O3 will resist accumulation less than the ones on α-SiO2, because the former are more easily remobilized.
In this paper a very crude difference scheme will be shown to be able to illustrate two simple cases (a much more sophisticated model based on the philosophy presented here has been published by Amir and Kern, 2010, in cache). In both cases, remobilization of a contaminant deposit leads to a migrating contaminant wave carrying the remobilized inventory. The difference scheme meets the requirements of von Neumann stability and small truncation error [Lax and Wendroff, 1960], while using a negligible fraction of the total computing time.
The set of difference equations used in the model (MINTRANS) is
(26)
(Ctikm+1 - Ctikm) / Dt + v0 (cikm - cik-1m)/Dx = 0.
k denotes a position and m a time step:
ci(kDx, mDt) = cikm.
The set (26) expresses the mass balance for transport in a chain of cells k, each cell having a length Dx and spatially uniform equilibrium concentrations Ctikm, cikm (with Ctikm = Cikm+cikm). Dt is the time necessary to exchange the soluble phases of the cells:
(27)
Dx/Dt = v0 ≥ vj for j = 1, 2, ..., n.
vj is any possible concentration velocity in the chain. Because of (27) the scheme (26) satisfies the Courant-Friedrichs-Lewy convergence condition [Lax and Wendroff, 1960].
Equation (26) is an appropriate difference scheme for (2) in the following two situations:
The cells contain an adsorbent (goethite) and an aqueous solution (no gas phase). The chemical components are Ca2+, Na+, CO32-, Cl-, SO42-, and Ni2+, the latter being the contaminant. The appendix gives the data used in the calculations. The chemical model is the triple layer model as implemented in MINEQL-SGMA. The initial states of the chain of cells is given in Tab. 1.
cNi,ko << CNi,ko
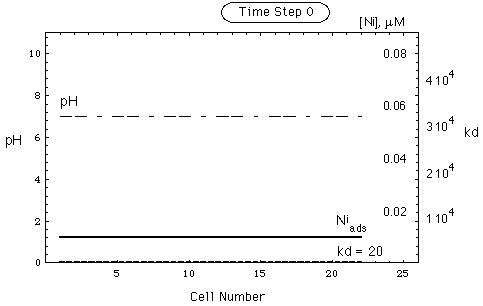
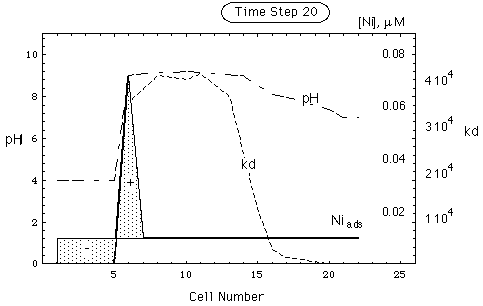
FIGURE 5. Spatial concentration, kd and pH distribution in a nickel deposit adsorbed on goethite. Environment contains calcite as pH buffer. Upper part of figure: undisturbed environment. Lower part: environment after intrusion of remobilizing water having pH = 4 (see Tab. 1). The front of the intruding water has arrived in cell 21. Dotted curve gives CNi(c)/cNi(c). Curve representing soluble nickel coincides with abscissa. Shaded area marked (-) is remobilized Ni-inventory, shaded area marked (+) is accumulated Ni-inventory (secondary repository).
Contrary to scenario 1, in scenario 2 (Figs. 6a and b) the remobilizing front is poorly retarded. The intruding remobilizing water has the same composition as the water in the undisturbed deposit except for its higher calcium chloride concentration (10-2 M). Fig. 4 shows the variation of the kd of the contaminant in the deposit prior to and after remobilization (curves IC and Remob, respectively).
As mentioned above, calcium competes here with the contaminant for adsorption sites at high pH (process (d), above), because CtCa (appr.=) Sr. At low pH, the adsorbed calcium ions affect contaminant adsorption via the electrostatic field they build up at the surface (process (c), above).
When the calcium rich water intrudes into the initially calcium poor deposit, calcium adsorbs and increases the (positive charge repelling) surface potential. This, in turn, leads to the desorption of protons into the pore water. The result lies between two extremes, depending on the efficiency of the proton buffer in the system:
Solute transport is considered here for case 2. In Fig. 4 one can see that kd
An experimental example of a contaminant wave has possibly been shown in silicate soil underlying contaminated soils (S. Eberle (local link), see also: Sickerwasserprognose in "Sickerwässern auf der Spur: Tagung der Gesellschaft für Hydrogeologie über Wasserwirtschaft und Umweltschutz in München", Deutschlandfunk, Forschung Aktuell, 21.4.2004)
Cj = adsorbed concentration of component j, unit: M, first time used
Ctj = total concentration of component j = cj + Cj, unit: M, first time used
c = {c1, c2, ..., cn} = vector of soluble concentrations, unit: M, first time used
cj = soluble concentration of component j, unit: M, first time used
c' = soluble concentration upstream of the remobilizing front, unit: M, first time used
c" = soluble concentration downstream of the remobilizing front, unit: M, first time used
D = combined coefficient of diffusion and hydrodynamic dispersion, unit: m2/s, first time used
Δ = difference operator, Δc = c' - c", ΔC = C' - C", first time used
D = cell size operators in difference scheme (26), Dx = size of spatial cell, Dt = size of time step, first time used
∂ = partial derivative, first time used
f = remobilizing agent, first time used
fj = multicomponent adsorption isotherm of component j, unit: M, first time used
I = unit matrix, an (n x n) diagonal matrix with 1's in the diagonal, 0's off diagonal, first time used
i = index meaning chemical component, first time used
K = equilibrium surface complexation constant, unit: M, first time used
k = index for wave, k = 1, 2, ..., n, first time used
k-characteristic = line in {x, t} space on which c is constant, i.e. distance x that a fixed concentration cj travels on k-wave during time t, first time used
kdk(c) = k-eigenvalue of Q(c), generalized distribution coefficient in k-wave at concentration c defined as normalized adsorbed concentration (normalized with respect to soluble concentration), (unit: L/kg), first time used
kd = distribution coefficient of contaminant M, dimensionless, first time used
Note:
Kd = kd φ/(ρ (1 - φ))
Using this Kd, the retardation R = 1 + kd can be written as
R = 1 + ρ (1 - φ)/φ Kd.
For a discussion of the limited usefulness of the constant partitioning coefficient Kd see also chapter 2.3.1 "Constant Partition Coefficient (Kd) Model", page 2.16 in" "Understanding Variation in Partitioneing Coefficient, Kd, Values", Volume I: The Kd Model, Methods of Measurement, and Application of Chemical Reaction Codes, United States Environmental Protection Agency, Office of Air and Radiation, EPA 402-R-99-004A, August 1999 (in Cache)
k-shock = piecewise smooth solution of (3), first time used
kT = product of Boltzmann constant and absolute temperature, unit: eV, first time used
λk(c) = speed of concentration (vector) c in k-rarefaction wave, unit: m/s, first time used
l = index meaning soluble complex, first time used
M = unit mole/L, first time used
M = contaminant, present at trace concentration, first time used
[M++] = concentration of free ion M, unit: M, first time used
n = number of components in geochemical system (n = maximum of j), first time used
Q = Jacobian matrix of multicomponent isotherm, unit: dimensionless, first time used
[Ql] = concentration of soluble complex l containing contaminant M, unit: M, first time used
qfj = partial derivative of isotherm Cf with respect to concentration cj, unit: dimensionless, first time used
Rk(c) = 1 + kdk(c) = k-eigenvalue of (I + Q(c)), retardation of concentration (vector) c in k-rarefaction wave, unit: dimensionless, first time used
ρ = mass density of soil particle, unit g/cm3, first time used
ρk(c) = retardation of concentration (vector) c in k-shock wave, unit: dimensionless, first time used
s = index meaning adsorbed complex, first time used
σk(c) = speed of concentration (vector) c in k-shock wave, unit: m/s, first time used
σl(L) = side reaction coefficient for formation of a soluble complex MLx containing M and a background element L. It is the concentration of the soluble complex MLx divided by the concentration [M++] of the free (i.e. non complexed) ion M++, unit: dimensionless, first time used
σs = side reaction coefficient for adsorption of M. It is the concentration of the adsorbed complex S-OMOH divided by the concentration [M++] of the free ion M++, unit: dimensionless, first time used
S-O = adsorbing surface site, S being the oxide lattice and O the surface oxygen layer, unit: M, first time used
S-OH = hydrolyzed adsorbing surface site, unit: M, first time used
S-OMOH = adsorbing surface site the proton of which has been replaced with the MOH complex, unit: M, first time used
Sr = total number of adsorption sites, unit: M, first time used
Σj = summation over j, first time used
t = time variable, unit: s, first time used
Φ = is the average volumetric water content of the porous medium (to simplify notation, Φ = 1 was used in chapter "Mechanism of Accumulation"), first time used
Ψ0 = electrostatic potential at surface, unit: V, first time used
Ψβ = electrostatic potential in beta plane, unit: V, first time used
v0 = flux of water in direction of x, unit: m3/(m2 s) = m/s, first time used
x = spatial variable, unit: m, first time used
{x, t} space = space with abscissa x and ordinate t, first time used
Legend
A similar scenario would be one in which the goethite surfaces release protons upon desorption of sulfate or chloride ions. This happens when the intruding (remobilizing) water has a smaller concentration of these anions than the initial pore water in the deposit.
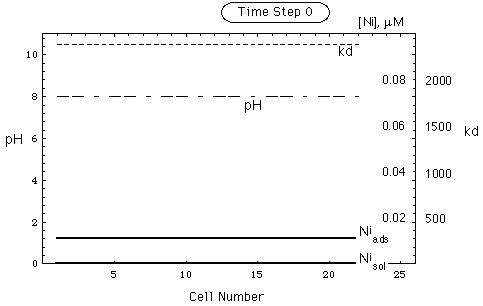
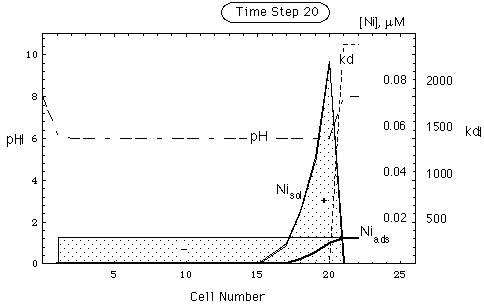
FIGURE 6. Spatial concentration, kd and pH distribution in a nickel deposit adsorbed on goethite, no pH buffer. Upper part of figure: undisturbed environment. Lower part: deposit after intrusion of remobilizing water. Intruding water front is in cell 21. pH in intruding water is the same as in undisturbed environment. Ni inventory has been remobilized (shaded area, -) and put into solution (shaded area, +).
CONCLUSIONS
Remobilization of a deposit of an adsorbed contaminant results in a migrating wave of possibly largely elevated contaminant concentration either adsorbed or in solution, if the remobilized contaminant inventory can follow the movement of the remobilizing front on its way through the deposit.
Oxides of iron, aluminum, titanium, and silicium are of particular interest, because their adsorption properties vary strongly with solution composition. The waves of major species, such as protons, released from oxide surfaces upon disturbance by infiltration of remobilizing water can amplify contaminant remobilization if buffers are insufficient.
This paper has shown that investigations of the groundwater pollution potential of contaminated adsorbents have to start by determining which remobilizing fronts can develop in the environments of concern and with what velocities vf these fronts might migrate. Subsequently, the compositions upstream and downstream of these fronts have to be used in batch experiments to determine the contaminant adsorption isotherms. This sequence of investigations will enable us to single out critical remobilization processes, i.e. those leading to contaminant build-up at migrating remobilizing fronts.
ACKNOWLEDGEMENT
Part of this research was sponsored at Los Alamos National Laboratory by the "Toxic Substances Research and Training Program" of the University of California at Riverside.
Notation
C = {C1, C2, ..., Cn} = vector of adsorbed concentrations, unit: M = moles/l, first time used
k-rarefaction wave = continuous solution of (3), first time used
The partitioning coefficient Kd = (μg of contaminant M per kg of solid) / (μg of contaminant M per liter of liquid at equilibrium with the solid), dimensions: L/kg
REFERENCES
Altmann, R.S., Copper binding in heterogeneous, multicomponent aqueous systems: mathematical and experimental results, Ph.D. thesis, Department of Civil Engineering, Stanford University, Stanford, CA, 1984.
Amir, L, and M. Kern, A global method for coupling transport with chemistry in heterogeneous porous media, Comput. Geosci. 14:465Ð481, 2010 (in cache)
Anderson, M.P., Using models to simulate the movement of contaminants through groundwater flow systems, CRC Crit. Rev. Environ. Control, 9 (2), 97-156, 1979.
Baes, C.F., Jr., and R.E. Mesmer, The Hydrolysis of Cations, John Wiley, New York, NY, 1976.
Balistrieri, L., and J.W. Murray, Surface of goethite (α-FeOOH) in seawater, in Chemical Modeling in Aqueous Systems, E. A. Jenne, ed., Am. Chem. Soc. Symp. Ser., 93, 275-298, 1979.
Balistrieri, L., and J.W. Murray, The surface chemistry of goethite (α-FeOOH) in major ion sea water, Am. J. Sci., 281, 788-806, 1981.
Balistrieri, L.S., and J.W. Murray, The adsorption of Cu, Pb, Zn, and Cd on goethite from major ion seawater, Geochim. Cosmochim. Acta, 46, 1253-1265, 1982.
Ball, J.W., D.K. Nordstrom, and E.A. Jenne, Additional and revised thermodynamic data and computer code for WATEQ2 a computerized chemical model for trace and major element speciation and mineral equilibria of natural waters, U.S. Geol. Surv. Water Resour. Invest., 78-116, 1980.
Benhadid, S., Simulation numerique des echanges des fluides roches (cas de deux constituants). Universite de Saint-Etienne, Departement Mathematique, Rapport de DEA, 1984.
Benjamin, M.M., Effects of competing metals and complexing ligands on trace metal adsorption at the oxide/solution interface, Ph.D. thesis, Department of Civil Engineering, Stanford University, Stanford, CA, 1978.
Butters, G., W.A. Jury and F.F. Ernst, Field scale transport of bromide in an unsaturated soil, Water Resour. Res. (in press), 1989.
Cederberg, G.A., R.L. Street, and J.O. Leckie, A groundwater mass transport and equilibrium chemistry model for multicomponent systems, Water Resour. Res., 21, 1095-1104, 1985.
Charbeneau, R.J., Multicomponent exchange and subsurface solute transport: characteristics, coherence, and the Riemann problem, Water Resour. Res., 24, 57-64, 1988.
Davis, J.A., R.O. James, and J.O. Leckie, Surface ionization and complexation at the oxide/water interface: 1. Computation of electric double layer properties in simple electrolytes, J. Colloid Interface Sci., 63, 480-499, 1978.
Davis, J.A., and J.O. Leckie, Surface ionization and complexation at the oxide/water interface: 2. Surface properties of amorphous iron oxyhydroxide and adsorption of metal ions, J. Colloid Interface Sci., 67, 90-107, 1978.
DeVault, D., The theory of chromatography, J. Am. Chem. Soc., 65, 532-540, 1943.
Dubrovsky, N.M., J.A. Cherry, and E.J. Reardon, Geochemical evolution of inactive pyritic tailings in the Elliot Lake uranium district, Can. Geotech. J., 22, 110-128, 1985.
Eagleson, P.S., Climate, soil, and vegetation: 2. The distribution of annual precipitation derived from observed storm sequences, Water Resour. Res., 14, 713-721, 1978.
Foerster, R., A multicomponent transport model, Geoderma, 38, 261-278, 1986.
Glueckauf, E., Ion Exchange and its Applications, Soc. of Chemical Industry, 34, London, 1955.
Grove, D.B. and K.G. Stollenwerk, Computer model of one-dimensional equilibrium controlled sorption processes, Water Resources Investigations Report 84-4059, US Geological Survey, Denver, CO, 1984.
Gruber, J., Natural geochemical isolation of neutron-activated waste: scenarios and equilibrium models, Nuclear and Chemical Waste Management, 8, 13 - 32, 1988.(updated version)
Gruber, J., Waves in a two-component system: the oxide surface as a variable charge adsorbent, Ind. Eng. Chem. Res., 34, 2769-2781, 1995.(updated version)
Guy, B., Certaines alternances recurrentes rencontrees dans les skarns et les structures dissipatives au sens de Prigogine: un rapprochement, C.R. Acad. Sc., Paris, 292, II, 413-416, 1981.
Guy, B., Nonlinear convection problems in geology, in: Irreversible phenomena and dynamical systems analysis in geosciences, 511-521, C. Nicolis and G. Nicolis (eds.), Reidel Pub. Co., Norwell, MA, 1986.
Helfferich, F. and G. Klein, Multicomponent Chromatography - Theory of Interference, Marcel Dekker, New York, 1970.
Hohl, H., and W. Stumm, Interaction of Pb2+ with hydrous γ-Al2O3, J. Colloid Interface Sci., 55, 281-288, 1976.
Honeyman, B.D., Cation and anion adsorption at the oxide/solution interface in systems containing binary mixtures of adsorbents, Ph.D. thesis, Department of Civil Engineering, Stanford University, Stanford, CA,1984.
Hunt, J.R., N. Sitar, and K.S. Udell, Nonaqueous phase liquid transport and cleanup, 1. Analysis of mechanisms, Water Resour. Res., 24, 1247-1258, 1988.
Hwang, Y.L., F.G. Helfferich, and R.J. Leu, Multicomponent equilibrium theory for ion-exchange columns involving reactions, AIChE Journal, 34, 1615-1626, 1988.
James, R.O. and M.G. MacNaughton, The adsorption of aqueous heavy metals on inorganic minerals, Geochim. Cosmochim. Acta, 41, 1549-1555, 1977.
James, R.O. and G.A. Parks, Characterization of aqueous colloids by their electrical double-layer and intrinsic surface chemical properties, Surf. Coll. Sci., 12, 119-216, 1982.
Jenne, E.A., Controls of Mn, Fe, Co, Ni, Cu, and Zn concentrations in soils and water: the significant role of hydrous Mn- and Fe-oxides, in: Trace inorganics in water, R. F. Gould (ed.), Adv. Chem. Ser., 73, 337-387, Am. Chem. Soc., Washington, D.C.,1968.
Jury, W.A., Simulation of solute transport using a transfer function model, Water Resour. Res., 18, 361-368, 1982.
Jury, W.A. and G. Sposito, Field calibration and validation of solute transport models for the unsaturated zone, Soil Sci. Soc. Am. J.., 49, 1331-1341, 1985.
Kent, D.B., V.S. Tripathi, N.B. Ball, and J.O. Leckie, Surface-complexation modeling of radionuclide adsorption in sub-surface environments, Techn. Report No. 294, Sandia National Laboratories, Albuquerque, NM, 1986.
Killey, R.W.D. et al., Subsurface cobalt-60 migration from a low level waste disposal site, Environ. Sci. Technol., 18, 148-156, 1984.
Kirkner, D.J. and H. Reeves, Multicomponent mass transport with homogeneous and heterogeneous chemical reactions: the effect of the chemistry on the choice of numerical algorithm, part 1: theory, Water Resour. Res. 24, 1719-1729, 1088.
Lax, P., Hyperbolic systems of conservation laws and the mathematical theory of shock waves, Society for Industrial and Applied Mathematics, Philadelphia, PA, 1973.
Lax, Peter D., @ResearchGate
Lax, P., and B. Wendroff, Systems of conservation laws, Comm. Pure Appl. Math., 13, 217-237, 1960.
Lichtner, P.C., Continuum model for simultaneous chemical reactions and mass transport in hydrothermal systems, Geochim. Cosmochim. Acta, 49, 779-800, 1985.
Martell, A.E., and R.M. Smith, Critical Stability Constants, Vol. 1, Amino Acids, Plenum Press, New York, 1974.
Mattigod, S.V. and G. Sposito, Estimated association constants for some complexes of trace metals with inorganic ligands, Soil Sci. Soc. Am., 41, 1092, 1977.
Novak, C.F., R.S. Schechter, and L.W. Lake, Rule-based mineral sequences in geochemical flow processes, AIChE Journal, 34, 1607-1614, 1988.
Ortoleva, P. et al., Redox front propagation and banding modalitites, Physica, 19D, 334-354, 1986.
Ortoleva, P., E. Merino, G. Moore, and J. Chadam, Geochemical self-organization I: Reaction-transport feedbacks and modeling approach, Am. J. Sci., 287, 979-1007, 1987.
Pfann, W.C., Zone melting, John Wiley, New York, 1958.
Peterson, S.R., W.J. Martin, and R.J. Serne, Predictive geochemical modeling of contaminant concentrations in laboratory columns and in plumes migrating from uranium mill tailings waste impoundments, NUREG/CR-4520, PNL-5788, Pacific Northwest Laboratories, Richland, WA, 1986.
Prigiobbe, V., Hesse, M., and Bryant, S.L. Hyperbolic Theory for Flow in Permeable Media with pH-dependent Adsorption, J. Appl. Math. 73, 5, 1941- 1957, Society for Industrial and Applied Mathematics, 2013,
http://epubs.siam.org/doi/abs/10.1137/130907185
http://www.researchgate.net/publication/259044134_HYPERBOLIC_THEORY_FOR_FLOW_IN_PERMEABLE_MEDIA_WITH_PH-DEPENDENT_ADSORPTION/file/9c960529d47a873def.pdf
E-Mail: valentina.prigiobbe@austin.utexas.edu
Reeves, H. and D.J. Kirkner, Multicomponent mass transport with homogeneous and heterogeneous chemical reactions: the effect of the chemistry on the choice of numerical algorithm, part II: numerical results, Water Resour. Res. 24, 1730-1739, 1988.
Richter, R.O., Chemical speciation of fly ash leachate in the underlying soil/water system with emphasis on the adsorption of nickel by oxides, Ph.D. thesis, University of Notre Dame, Indiana, 1978.
Serne, R.J., S.R. Peterson, and G.W. Gee, Laboratory measurements of contaminant attenuation of uranium mill tailings leachates by sediments and clay liners, NUREG/CR-3124, PNL-4605, Pacific Northwest Laboratories, Richland, WA, 1983.
Sillen, L.G. and A.E. Martell, Stability Constants of Metal-Ion Complexes, The Chemical Society, London, Special Publication 17, 1964, and Special Publication 17, Supplement No. 1,1971.
Smith, R.M. and A.E. Martell, Critical Stability Constants, Vol. 4: Inorganic Complexes, Plenum Press, New York, NY, 1976.
Stumm, W. and J.J. Morgan, Aquatic Chemistry, 2nd ed., John Wiley, 1981.
Theis, T.L. , D.J. Kirkner, and A.A. Jennings, Multisolute subsurface transport modeling for energy solid wastes, Techn. Report C 00-10253-3, Ecological Research Division, Office of Health and Environmental Research, US Department of Energy, Washington, DC, 1982.
Tripathi, V.S., Uranium transport modeling: geochemical data and submodels, Ph.D. thesis, Department of Applied Earth Sciences, Stanford University, Stanford, CA 94305, 1984.
Turner, D.R., M. Whitfield, and A.G. Dickson, The equilibrium speciation of dissolved components in freshwater and seawater at 25 C and 1 atm pressure, Geochim. Cosmochim. Acta, 45, 855-881, 1981.
Vuceta, J., Adsorption of Pb(II) and Cu(II) on α-quartz from aqueous solutions: influence of pH, ionic strength, and complexing ligands, Ph.D. thesis, Calif. Institute of Technology, Pasadena, CA, 1976.
Walsh, M.P., S.L. Bryant, R.S. Schechter, and L.W. Lake, Precipitation and dissolution of solids attending flow through porous media, AIChE Journal, 30, 317-328, 1984.
White, A.F., J.M. Delany, T.N. Narasimhan, and A. Smith, Groundwater contamination from an inactive uranium mill tailings pile, 1. Application of a chemical mixing model, Water Resour. Res., 20, 1743-1752, 1984.
APPENDIX:
Sources of Data Used in Computations
Complexation & Precipitation
Element
Reference
Ca
1, 2
Cd
1, 3, 4, 5
Cu
2, 4
Mg
1, 2, 3
Ni
1, 2, 3, 6, 7, 8
Pb
1, 2, 3
Zn
1, 2, 4
Cl, CO3, PO4, SO4
4
UO2
9
Adsorption
Element
Adsorbent
Reference
Ca, Mg, Na
G
11
Cd, Cu, Pb, Zn
G
12
Cd, Cu, Zn, Pb
A, F, Q
13
Cd, Mg
T
13
Ni
G
14, 15
Cl, SO4
G
11
UO2
G
9
Address of this Page
Physics Home
Last Changed: 25 May 2017
Joachim Gruber