Three Messengers
Start Video Three Messengers
Video does not play in my browser.
On our way in the Anthropocene we meet 3 strange messengers, and we think they come from the future. They exchange among themselves in metaphors whose grammar we believe to understand, but whose meaning is only vaguely clear to us.
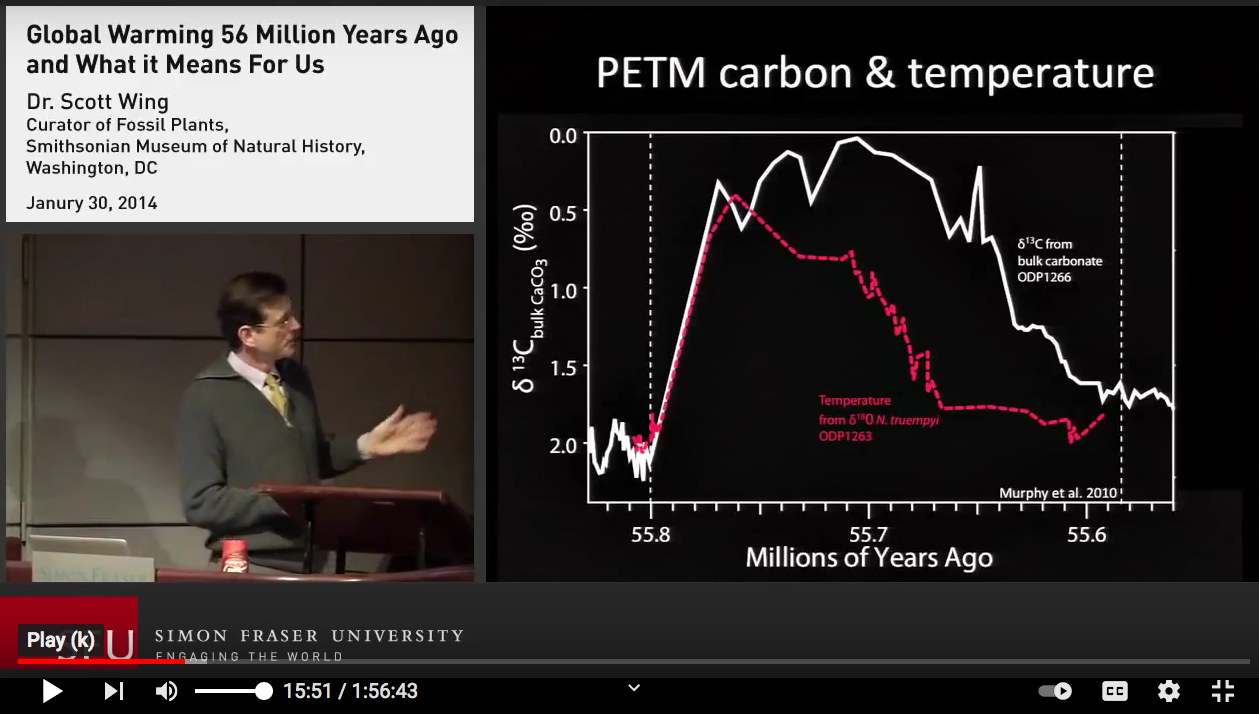
- Messenger 1 calls himself a paleontologist (Scott Wing),
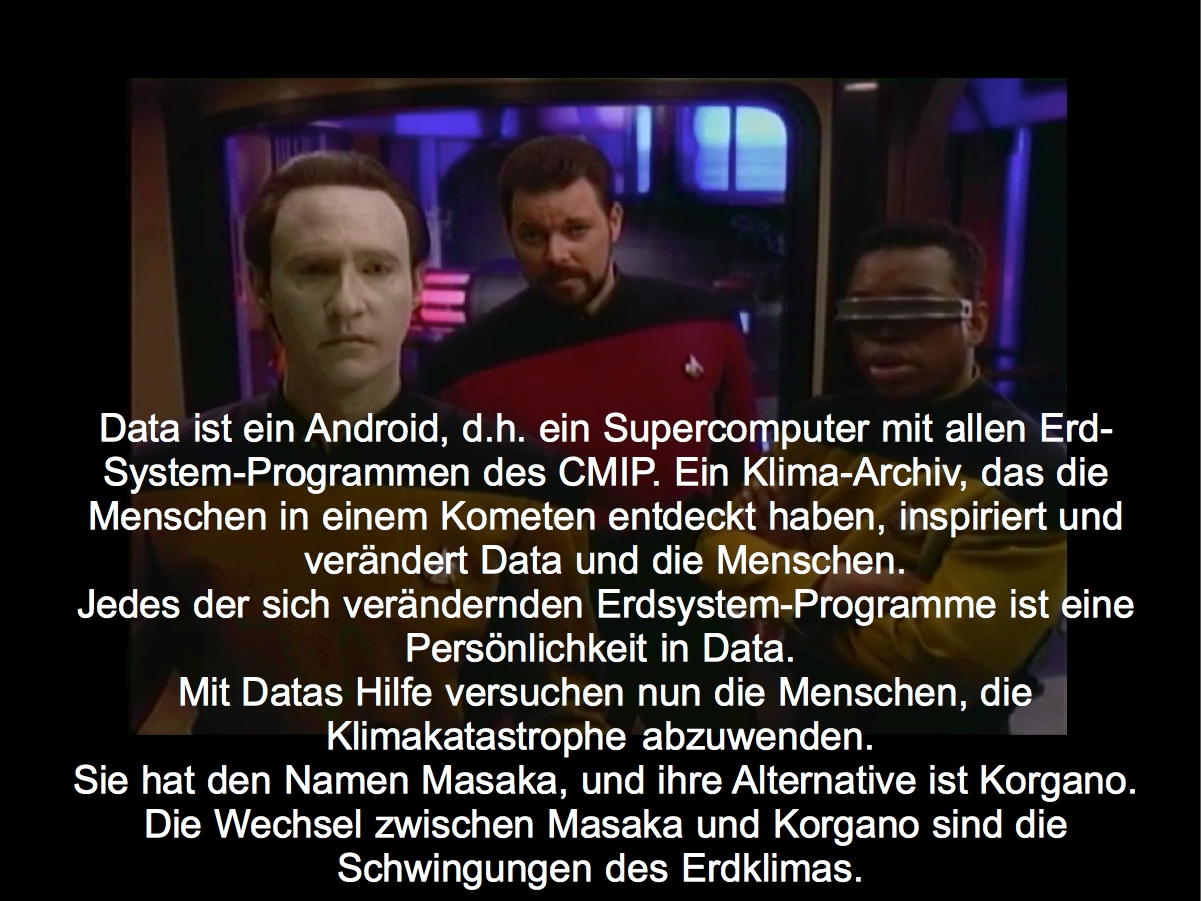
- Messenger 2 is called Climate Model Intercomparison Project, CMIP (Data),
- Messenger 3 calls himself a composer (Led Zeppelin).
What we finally understand clearly:
- Data's message relies on thousands of us "from all ages and walks of life" to set out to interpret the message. CMIP has to be a continuous effort inspired and led by all groupings of the global society.
- Otherwise we will not avert the climate catastrophe.
My -unanswered- question remains.
This video points to the energy that the climate emergency is releasing within us. Whether it becomes a blessing or a curse depends largely on the strength of the bonds between us.
A society is unstable if the people are socially "atomized" (according to Hannah Ahrendt), that is, if there is an extreme lack of social bonds between people. The transition of society from this unstable state to a stable, collective unit, a swarm, is what Mattias Desmet calls "mass formation". A post-mass-formation society is totalitarian in the sense that it generates all-encompassing group obsessions from within itself (example: Germany from the 1930s). Hannah Ahrendt says, "there is only one bond allowed in such a society, and that is the bond between the state (as the embodiment of the swarm) and the individual."
Mass formation always destroys the core of the human being, it destroys the humanity in man. We are human as long as we try to speak to each other, to exchange our thoughts and feelings in mutual respect. The use of language and the creation of a social bond through language, that is what occasionally distinguishes man from other living beings.
 |
Messenger 1: Scott Wing
Looking back to look forward |
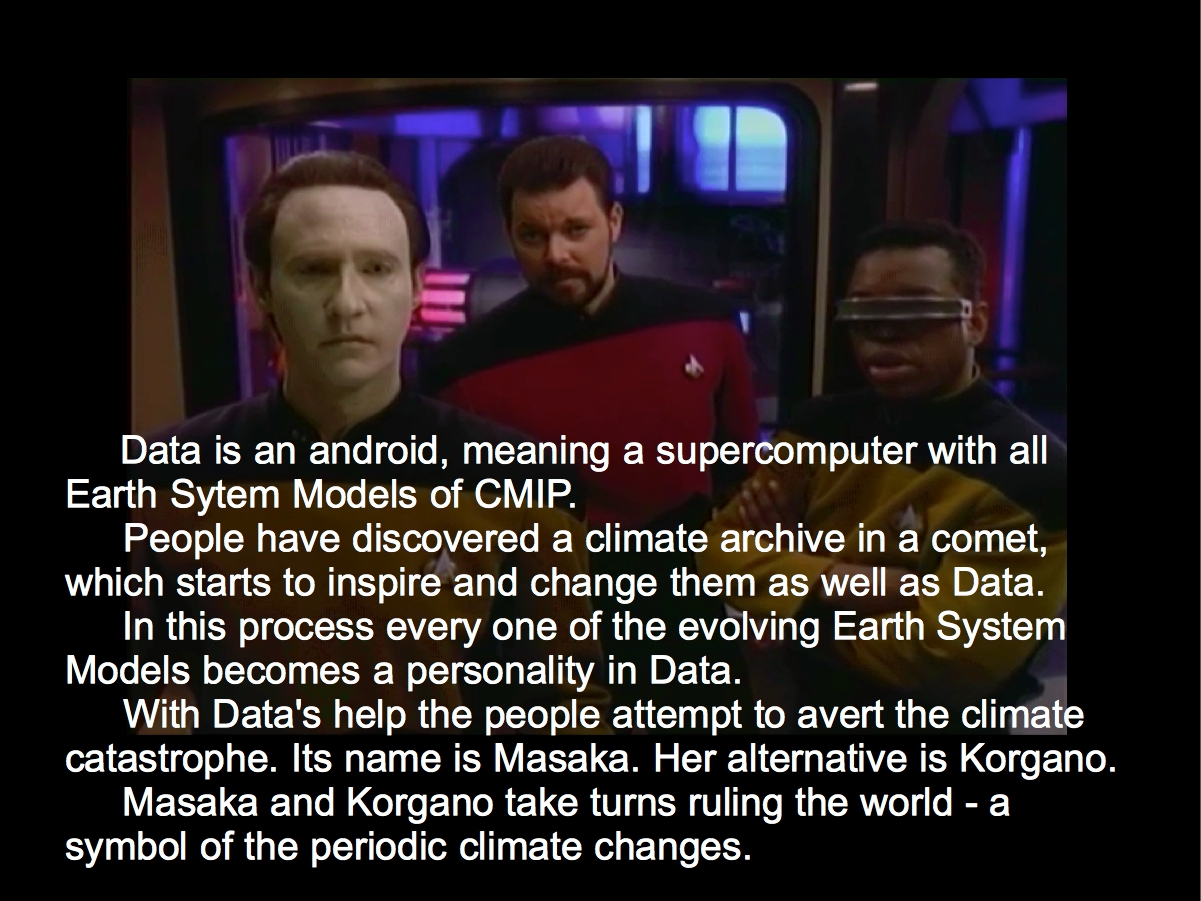 |
Messenger 2: CMIP
Building Masakas Temple |
|
|
Messenger 3: Led Zeppelin |
APPENDIX
The Climate Crisis
1 Implementing the 1.5°C target.
"We are missing the 1.5°C target." This is how we often express our concerns about the anthropogenic climate change.
In my research for the Neubrandenburg School of Applied Sciences, I have been exploring the basis of this phrase.
1.1 There are many ways to build Masaka's temple
see also The link between concentration, radiative forcing, and temperature (IPCC WGIII AR5, 6.3.2.6, page 438ff)

The global CO2 budget in 2020 for the 1.5°C target is
- with a 50%TCRE probability: Bg(1.5C, 50%TCRE) = 620 GtCO2,
- with a 67%TCRE probability: Bg(1.5C, 67%TCRE) = 500 GtCO2,
- with a 90%TCRE probability: Bg(1.5C, 90%TCRE) = 330 GtCO2.
The TCRE probability (e.g. 90%TCRE) is not the probability with which GMST = 1.5°C is arrived at after a cumulative CO2 emission (e.g. Bg(1.5C,90%TCRE) = 330 GtCO2).
|
Fig. 1: Planet Earth has the disease Homo Sapiens. Its fever temperature depends on the disease's seriousness.
Fever temperature (Global Mean Surface Temperature, GMST) of the earth according to the predictions of 20 Earth System Models.
(from IPCC SR15, Chapter 2, page 105, Figure 2.3)
The fever temperature GMST increases with the amount of greenhouse gases we humans release into the atmosphere.
x-axis: Amount of greenhouse gases emitted since 1876 measured as amount of carbon dioxide, expressed in GtCO2 since 1876,
y-axis: Earth temperature GMST in °C above that in 1876.
Predictions differ in assumptions about processes triggered by anthropogenic carbon.
- In models available online for free ("carbon cycle models"), controllable from the browser interface, one can specify key earth system parameters and calculate GMST as a function of anthropogenic carbon emissions.
- The GMST (°C) curves as a function of post-1876 global accumulated carbon emissions (GtCO2) lie in a plume of results depending on the choice of models and their parameters (Figure left).
- When all greenhouse gases are considered, the predictions lie in the upper plume,
- if only their CO2 fraction is considered, in the lower plume.
- Both plumes overlap in the dark area.
- The black line with yellow dots indicates the measured mean temperature in different years.
- The temperature predictions lie in the fan of gray straight lines (called TCRE fan, link in IPCC dictionary), if the Earth System Models
- are given the measured earth temperature in 2020,
- consider only the pure CO2 emissions.
- Because of (2), the gray fan loses its validity where it leaves the "CO2-only" plume.
- With some good will, one can find that the temperature predictions of the Earth System Models are normally distributed around a mean μ with a standard deviation σ ({μ, σ} = {0.54, 0.29} °C/(1000 GtCO2)). For example, the predictions
- of 50% of the models lie below the 50%TCRE fan line (mean),
- of 67% of the models lie below the 67%TCRE fan line,
- of 90% of the models lie below the 90%TCRE fan line.
There are always predictions (model results) that lie below or above the gray fan. But that does not make them any less credible. They are simply based on assumptions that are not shared by the bulk of the calculations. There are a number of good reasons for this. Some of them were pointed out by Dieckhoff and Leuschner in 2016.
|
The definition of the 1.5°C target is based on 3 largely arbitrary assumptions
- Selection of the global CO2 budget from the results plume in Figure 1.
The remaining global carbon emission budget which limits global warming to GMST = 1.5°C will be called "CO2 budget". It can be given by the Earth System Models only as an asymmetric range around 500 GtCO2 with a width of 1000 to 2000 GtCO2 (Figure 1).
Illustrative interpretation of the fuzziness: The Earth has (the disease) Homo Sapiens.
In this analogy
- the global emission of carbon into the Earth's atmosphere corresponds to an infection of our body,
- global warming is a symptom similar to our fever,
- the limited medical knowledge corresponds to the fuzziness of the Earth System Models.
The level of our fever does not only depend on how much germs we have taken in. It varies depending on our overall health.
Similarly, global warming does not depend only on the cumulative amount of carbon we impose on the Earth. What amount leads to a 1.5°C fever depends on the general health of the earth, about which opinions differ among climatologists (e.g., in CMIP). And what kind of disease develops at this fever temperature, we also know only very insufficiently.
- Climatologists are working to figure out at what carbon level we are still on the safe side and what "safe side" means.
- With my video, I want to illustrate how uncertain the terrain we are on is.
- Allocation of the global CO2 budget
Once we have decided on a global CO2 budget, we need to distribute it among the signatories of the Paris Agreement. We must responsibly shape the room for maneuver in this process.
- Historical responsibility
The extent to which past CO2 emissions must be taken into account in the allocation is another challenge.
The FridaysForFuture movement and its support by affiliated ForFuture movements (ScientistsForFuture, ParentsForFuture, etc.) take the following approach to (1) through (3):
- Global CO2 budget
As of Jan. 1, 2018 the global CO2 budget was according to IPCC, SR15, Chapter 2, Table 2.2, page 108
- (FFF1) 420 GtCO2 for 1.5°C global warming (since 1850),
- (FFF1alt) 800 GtCO2 for 1.75°C global warming (since 1850).
- Allocation of the global CO2 budget
- (FFF2) The CO2 budget is distributed equally among all 8 billion people (Equal Per Capita (EPC), IPCC WG3 AR5 (Chapter 6, Abschnitt 6.3.6.6 Regional mitigation costs and effort-sharing regimes, pages 458 ff). Thus, on Jan. 1, 2018 Germany receives 1% of the global CO2 budget, i.e. 4.2 and 8.0 GtCO2, respectively.
- Historical responsibility
- (FFF3) If the date of allocation is set to Jan.1, 2016, one has to subtract the German carbon emissions of the period Jan. 1, 2016 through Dec. 31, 2017 (1.8 GtCO2eq) from the CO2 budget after FFF2.
This leaves Germany with (4.2 - 1.8 =) 2.4 and (8.0 - 1.8 =) 6.2 GtCO2 for the period after Jan. 1, 2018.
However, Germany actually emitted 3.2 GtCO2eq between Jan. 1, 2018 and Dec. 31, 2021, so with respect to the 1.5°C target (2.4 GtCO2) Germany is carbon insolvent.
- (FFF3alt) Given the arbitrariness of FFF1 through FFF2 one could set the allocation date to Jan. 1, 2020 and use the 2020 global CO2 budget (520 GtCO2 for 1.5 °C or 890 GtCO2 for 1.75 °C) according to IPCC SR15 (Chapter 2, Table 2.2, page 108).
So, as of Jan. 1, 2020 Germany's CO2 budget is 5.2 and 8.9 GtCO2, respectively.
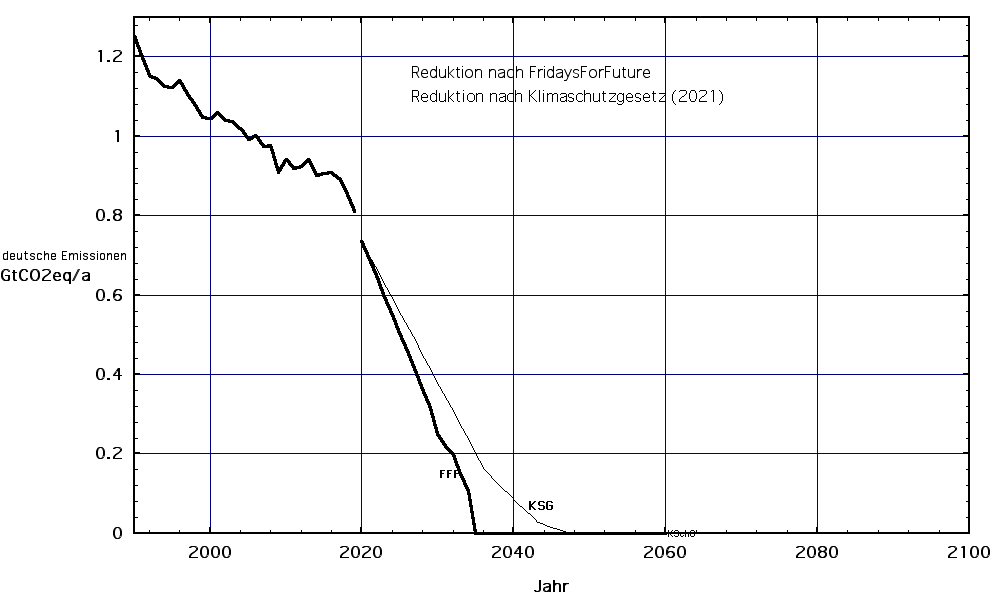
Fig. 2a: Emission reduction paths according to Climate Protection Act 2021 (KSG) and FridaysForFuture (FFF).
Between 1990 and 2019, measured annual greenhouse gas emissions (in GtCO2eq) are plotted.
Beginning in 2020, annual emissions targets for CO2 are plotted. Since agriculture essentially emits non-CO2 greenhouse gases, its emissions targets are not included here. This leads to the gap between the curve and the FFF line or KSG line.
|
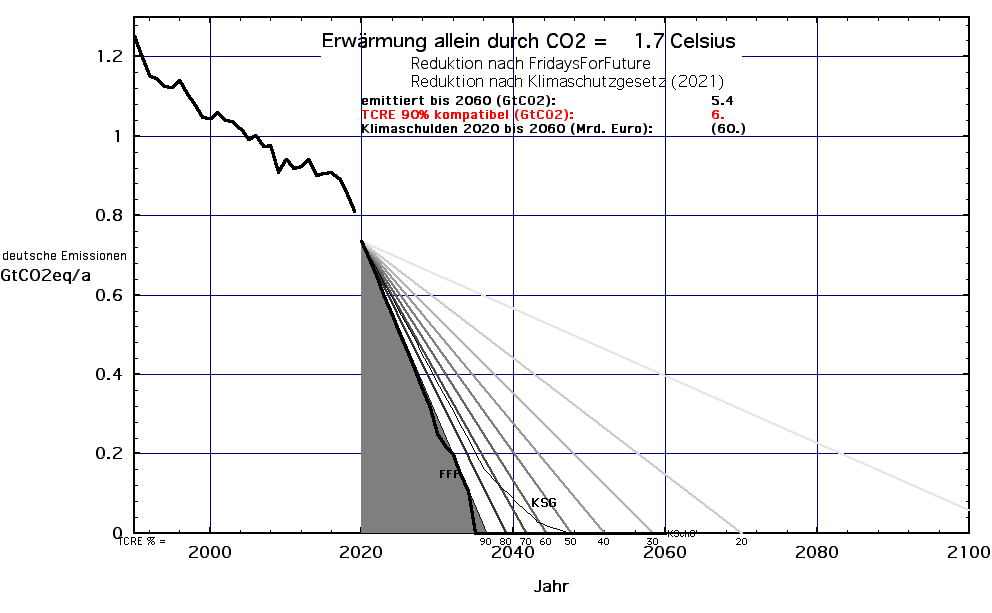
Fig. 2b: Overlay of Figure 2a with German CO2 budget at 10%TCRE to 90%TCRE.
In contrast to Figure 1, in this plot the CO2 budgets Bg are areas.
Bg(1.7°C, x%TCRE) with x = 10, 15, 20, ... 85, 90
- According to FFF2 the German CO2 budgets Bd(1.7C, x%TCRE) are 1% of the global CO2 budgets
Bd(1.7°C, x%TCRE) = 0.01 Bg(1.7C, x%TCRE).
- Conveniently, one plots Bd(1.7°C, x%TCRE) for each x as a triangle with a right angle in 2020. Then it is easy to see which reduction path (here FFF and KSG) coincides with which Bd(y°C, x%TCRE), i.e., which Paris target y°C will be met under conditions FFF1, FFF2, FFF3alt.
- Results:
- The area under the FFF reduction path is equal to the (gray) area Bd(1.7°C, 90%TCRE). Thus, under the conditions FFF1, FFF2, FFF3alt, the CO2 emission reductions promoted by FridaysForFuture meet the 1.7°C target with 90%TCRE probability.
- Correspondingly, German CO2 emissions under the Climate Protection Act 2021 (KSG) meet the 1.7°C target with 75%TCRE probability.
- However, these reductions do not meet the 1.7°C target if FFF3alt is replaced by FFF3. This illustrates the arbitrariness of the term y°C target.
|
2.1 FFF
The German FFF movement derives concrete emission targets for industry from FFF1 to FFF3.
Essentially, it locates the responsibility for limiting global warming with industry, not with citizens.
2.2 Federal Environment Agency (Umweltbundesamt)
Building on the emission targets in the German Climate Protection Act 2021, one can derive emission targets for every German using FFF1 to FFF3 and the Federal Environment Agency's CO2 calculator analogous to 2.1.
This results in the following (details):
- If every German, with average consumer behavior in the remaining sectors,
- (x) reduces the distance he travels by car from an average of 9000 km per year to 0 (e.g. by using public transportation), or
- (y) reduces his air travel from an average of 4 hours per year to 0, or
- (z) does not embark on ship cruises (following the average German),
then Germany meets the target defined by assumptions FFF1alt, FFF2 and FFF3alt.
- Germany meets the 1.5°C target if we Germans are at (x) to (z) on average and
- our "other consumption" is 200 euros per month.
By "other consumption", the Federal Environment Agency means everything except food, housing (including heating and electricity) and mobility (including travel).
2.3 Fraunhofer Institute ISE
Similarly, the Fraunhofer Institute for Solar Energy Systems (ISE) quantifies the responsibility of every German to meet the 1.5°C target in its February 2020 study.
3 Result
While FFF places the responsibility mainly on industry, others point out the considerable co-responsibility of citizens.
3.1 First Step
The FFF movement finds the climate crisis alarming. With the video Three Messengers, I would like to convey the concern.
3.2 Second Step
In a follow up (in the future), I would like to use similar stylistic elements to point out the responsibilities in realizing the Paris Agreement. Our new government and legislature has set itself the goal of paving the way for industry to achieve climate-neutral products and production methods by creating new regulatory frameworks. The past has shown how much government and parliament need our cooperation.
- German industry will have a decisive influence on global CO2 emissions if it can demonstrate Germany as a successful β tester country for its CO2-neutral products and production methods.
- In comparison, the CO2 emissions in Germany (not counting the CO2 emissions due to the production of imported goods which may be rather large) is 2% of the global CO2 emissions. If we Germans were to reduce those CO2 emissions to near 0 through an extraordinary effort, it would still remain invisible globally.
enlarge picture
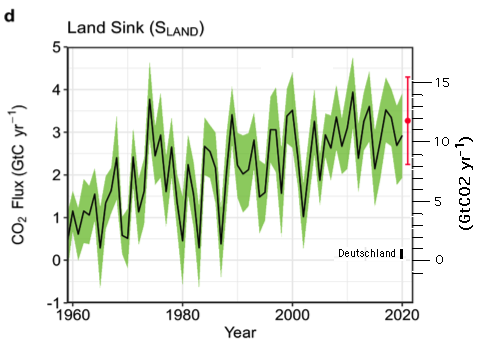
Annual carbon uptake by land surface (vegetation, soil).
Bar: German carbon emissions in 2020.
Source: page 127 in Global Carbon Budget 2021
|
The reason: In spring and summer global vegetation inhales CO2 and then exhales CO2. This fluctuates from year to year by more than 2% - and we have little influence over it - in a similar way to how agricultural harvests fluctuate from year to year, without us being able to significantly change this.
|
Version: 19.11.2023
Address of this page
Home
Jochen Gruber