Auszug aus
Gabriela Gomes et al.
Individual variation in susceptibility or exposure to SARS-CoV-2 lowers the herd immunity threshold
medRxiv, 21 May 2020
https://www.ncbi.nlm.nih.gov/pmc/articles/PMC7239079/
https://www.medrxiv.org/content/10.1101/2020.04.27.20081893v3.full.pdf
https://www.medrxiv.org/content/10.1101/2020.04.27.20081893v3.supplementary-material
Abstract:
As severe acute respiratory syndrome coronavirus 2 (SARS-CoV-2) spreads, the susceptible subpopulation is depleted causing the incidence of new cases to decline. Variation in individual susceptibility or exposure to infection exacerbates this effect. Individuals that are more susceptible or more exposed tend to be infected earlier, depleting the susceptible subpopulation of those who are at higher risk of infection. This selective depletion of susceptibles intensifies the deceleration in incidence. Eventually, susceptible numbers become low enough to prevent epidemic growth or, in other words, the herd immunity threshold (HIT) is reached.
Although estimates vary, simple calculations suggest that herd immunity to SARS- CoV-2 requires 60-70% of the population to be immune.
By fitting epidemiological models that allow for heterogeneity to SARS-CoV-2 outbreaks across the globe, we show that variation in susceptibility x (or exposure x) to infection reduces these estimates.
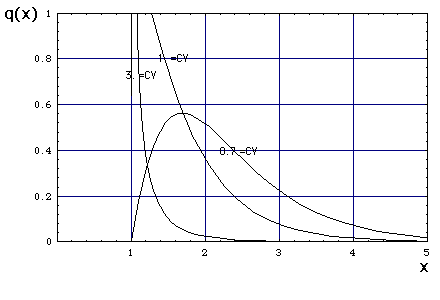
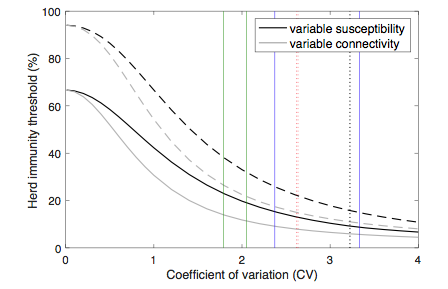
We integrate continuous distributions q(x) of susceptibility or connectivity in otherwise basic epidemic models (SEIR) for COVID-19 and show that as the coefficient of variation (CV) increases from 0 to 4, the herd immunity threshold declines from over 60% to less than 10%.
 ......................................................................................................................
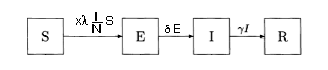
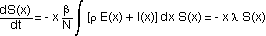
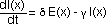
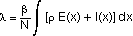
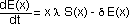 ................................................................................................................................................................... (eq. 1, "SEIR model")
 .............................................................................................................................................................................
 ............................................................................................................................................................................................
Notation
 = basic reproduction number .............................................................................................................................. (eq. 2)
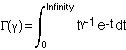
q(x) = probability density function of the gamma distribution ("Gamma Distribution")
|
with (note: γ and β used here are different from the parameters used in eq. 2)
|
Fig. J1: q[x] = probability density function of the gamma distribution. Abscissa = x, ordinate = q(x), μ = 1, β = 1,
|
|
|
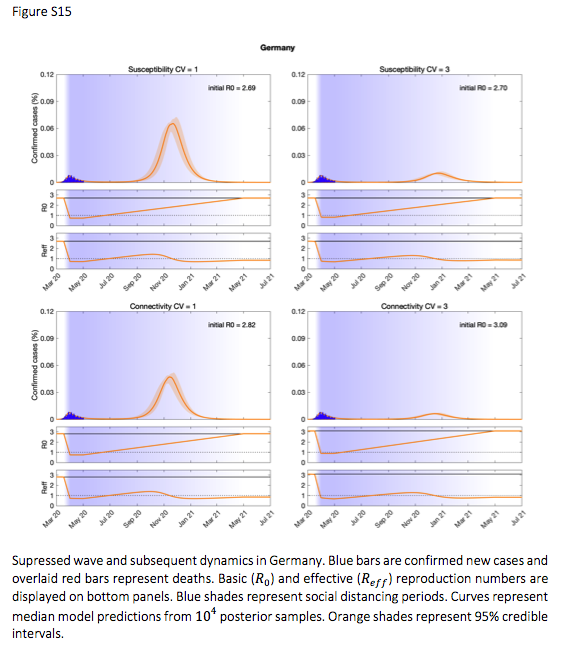
Figure 1: The effect of variation in susceptibility to infection on the size of epidemics. Suppressed wave and subsequent dynamics. Blue bars are confirmed new cases and overlaid red bars represent deaths.
in March due to a lockdown and is assumed to increase to the pre-lockdown value along with the gradual relaxation of the lockdown conditions] and are displayed on bottom panels. Blue shades represent socialdistancing (intensity reflected in Ro trends and shade density).
Curves represent median model predictions from 104�posterior samples. Orange shades represent 95% credible intervals. |
|
Figure 3: Herd immunity threshold with variation in susceptibility and exposure to infection. Curves generated with the model (Equation 1) with gamma distributed susceptibility (black) or connectivity (gray) assuming Ro = 3: (solid) herd immunity threshold (HIT); (dashed) final size of uncontrolled epidemic. Vertical lines indicate coefficients of individual variation for several infectious diseases according to literature: (solid green) susceptibility or exposure to malaria [Amazon 1.79 (6), Africa 2.05 (7)]; (solid blue) susceptibility or exposure to tuberculosis [Portugal 2.37, Brazil 3.33 (8)]; (dotted red) infectiousness for SARS-CoV-1 [Singapore 2.62, Beijing 2.64 (9)]; (dotted black) infectiousness for SARS-CoV-2 [3.22 (10)] |
Version: 15.2.2021
Address of this page
Home
Jochen Gruber
.png)