This paper is an updated version of J. Gruber, "High-level radioactive waste from fusion reactors", Environ. Sci. Tech. 17, 425 - 431, 1983.
High-Level Radioactive Waste from Fusion Reactors:
The Problem of Alloy Constituents and Impurities
by
Hahn-Meitner-Institut für Kernforschung GmbH
Glienicker Strasse 100, D 1000 Berlin 39, Federal Republic of Germany
mailing address at the time of finishing this paper, 1983:
Department of Applied Earth Sciences,
Stanford University, Stanford, CA 94305, USA
Parts of this paper were added while the author was Visiting Scholar at the
Los Alamos National Laboratory, Los Alamos, New Mexico, USA
Abstract
Highly radioactive waste is generated in fusion reactors by neutron irradiation of the reactor blanket. All major elements of construction, i.e. the alloy constitutents of stainless steel, the moderator (graphite) and the neutron multipliers (beryllium, bismuth or lead) as well as the impurities in each of these are likely to be activated. So, for every stable element of the periodic table we have estimated the activity with half life T > 10 years produced during the expected operating lifetime of a typical fusion reactor.
METHODS
The radioactive inventories of all chemical elements are evaluated after an operation time at which either reactor type has produced 1 GWthyr of energy. In view of the resulting long isolation times for the radioactive waste it is conservatively assumed that eventually (a) the entire long lived radioactive inventory enters into the biosphere, and (b) the radioactive elements have forgotten their origin and behave like the corresponding natural elements. The International Commission on Radiological Protection (ICRP) guidelines specify their permissible concentrations in drinking water. The evaluation uses two types of characteristic quantities. Both decrease over time, as given by the radioisotopes' specific half lives:
- Biological Hazard Potential, BHP, (m3), the maximum amount of permissibly contaminated drinking water that any element of the reactor can produce. Its numerical value is roughly equal to the maximum radiological dose (in rem) a population will receive when the entire radioactive inventory of that reactor element has entered into the population's biosphere ("potential population dose"). As long as BHP > 0.8 m3 (equivalent to a population dose of 0.5 rem), the inventory of the radioactive element is assumed to be hazardous.
- Specific activity, the radioactivity of a gram of any element from the reactor (Ci/g). Due to its radioactivity, any element's concentration in drinking water must not exceed a certain limit cp. That limit is compared with the range of concentrations ce found in natural waters. As long as cp < ce the element itself (not only its inventory) is considered hazardous.
RESULTS
(1) Biological Hazard Potential (Figs. 4a, b)
The radiological data for bismuth and beryllium are unknown and had to be conservatively assumed.
- The long lived population doses originating from fission reactor waste are (arranged by half life)
- 1.0 108 rem (Am243, T = 7.4 103 yr),
- 3.5 109 rem (Pu239, T = 2.4 104 yr),
- 1.4 106 rem (Np237, T = 2.1 106 yr).
- The long lived population doses originating from fusion reactor waste are (arranged by half life)
- 4 107 rem (Ni63, T = 102 yr),
- 1 104 rem (Ni59, T = 7.5 104 yr),
- 6 108 rem (Bi208, T = 3.7 105 yr),
- 4 106 rem (Be10, T = 1.6 106 yr), and
- 3 104 rem (Pb205, T = 1.4 107 yr).
(2) Specific activities (Figs. 5a, b)
Geochemical as well as fusion reactor material composition data are missing for most of the elements that have relevant long-lived radioisotopes. On the basis of extrapolations, in this classification scheme
- the most hazardous long lived fission reactor elements are probably the same actinides as in the BHP classification scheme if their geochemical properties are the ones presently known for plutonium. The following concentration limits cp (relevant radionuclide in (parentheses)) could be tolerable in aqueous biosphere environments
- americium (Am243, cp = 4 10-9 g/L water),
- plutonium (Pu239, cp = 1 10-8 g/L water),
- neptunium (Np237, cp = 2 10-6 g/L water).
- hazardous fusion reactor elements are
- molybdenum, an alloy constituent (Mo93, T = 3.5 103 yr, cp = 2 10-3 g/L water),
- bismuth, a neutron multiplier (Bi208, T = 3.7 105 yr, cp = 9 10-5 g/L water),
- chlorine, assumed to be present at a trace concentration of 1 ppm (Cl36, T = 3.0 105 yr, cp = 8 10-5 g/L water).
CONCLUSIONS
Isolation times of the order of a million years can be anticipated for fusion as well as fission reactor waste based on both types of characteristics, BHP as well as cp. The BHP and cp differences of fusion and fission reactor waste elements seem small in view of geochemical and biochemical parameter uncertainties and little known potential ranges of environmental conditions. Therefore, a fusion/fission comparison of effects like geochemical accumulation of the radioactive waste elements appears to be an extremely difficult and yet unsolved task.
Thus, the presently unknown environmental variabilities -rather than the differences presented in this publication- might determine which type of energy source is less hazardous.
Introduction: Fusion and Fission Compared
The nuclear fusion reactor is a potential energy source of the future [1]. The process providing the energy will be the fusion of two hydrogen isotopes, deuterium and tritium, which yields a helium atom and a neutron. The neutron emerges from the nuclear reaction zone, the so-called plasma, with a high speed carrying an energy of 14.1 MeV, the larger part of the nuclear energy released by the fusion reaction.
Since tritium cannot be obtained in sufficient quantities except from the nuclear reactors themselves, fusion reactors will be designed to generate ("breed") their own tritium supply (the tritium inventory in a reactor being of the order of 1 kg - 10 kg, in cache 1 kg, ≤10 kg). Since for every tritium nucleus consumed in the plasma one neutron is emitted, sufficient tritium is bred if every fusion neutron produces at least one tritium nucleus.
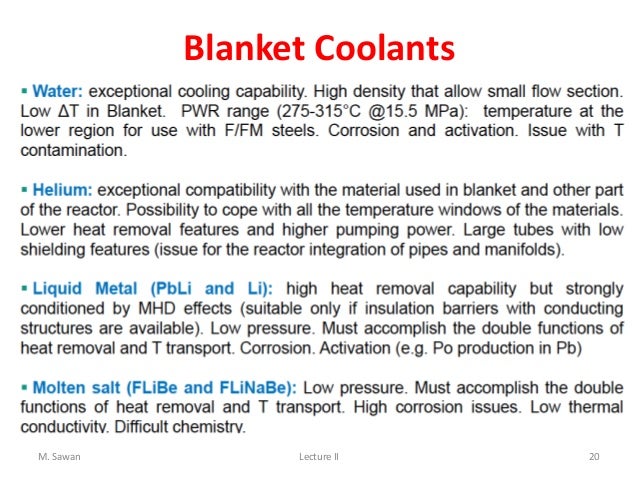
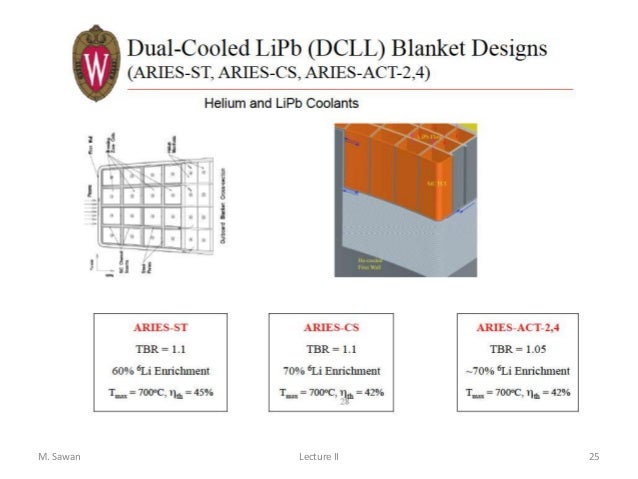
This is achieved in an assembly ("blanket") of three materials (details in slides 20 - 25 of Sawan, 2013 and Abdou, 1982):
- a neutron multiplier, e.g. lead, beryllium or bismuth,
- a neutron moderator, e.g. graphite, and
- the breeding material which consists mainly of lithium.
When lithtum atoms are exposed to neutrons they break apart, yielding helium and tritium atoms. The neutrons must have a low enough speed (be "thermal"), and the graphite serves the purpose to slow them down. In this process the graphite is in turn heated up by the neutrons. The purpose of the addition of the multiplier to the blanket is to compensate for neutron losses. Ultimately, after having penetrated the blanket the neutrons are absorbed in a shield composed of steel and boron carbide. On their way through blanket and shield the neutrons will change the matter from inactive to highly radioactive.
The most hazardous part of the activity within a fission reactor is considered to be the fission products and the actinides in the irradiated fuel element. Their activity is practically invariably connected with the fission process. In contrast to that, the amount and composition of future fusion reactor radioactive waste will largely depend on the choice of the materials of which it is made.
This provides fusion with valuable degrees of freedom with respect to the objectives and strategies of waste management, the choice of the blanket materials still being open. There are materials which could be used for the structure of reactor blankets which would produce only short lived activity (if trace impurities levels present in these materials producing long lived activity could be sufficiently reduced). On the other hand, those materials demand a largely unknown processing and manufacturing technology. At present, stainless steels are most likely chosen as structural material.
If stainless steel is employed as structural material in fusion reactors its activity will not differ much from the activity of the stainless steel of the core barrel of a fission reactor (cache, core barrel (cache) in Westinghouse nuclear reactor) since the thermal neutron flux is the main source of steel activation in both types of reactors and the fluxes are similar. Moreover, the weights of the core barrel on the one hand and the most active part of a fusion reactor, the wall surrounding the plasma (the "first wall"), on the other hand, are similar, i.e. 6 to 8 tons for reactors having a thermal power of 500 to 1000 MW.
The same is true for graphite, which is used in fusion as well as in some fission reactors to slow down the neutrons for their required fission reactions: In fission reactors the thermal neutrons fission uranium (or thorium) to produce energy. As mentioned above, in fusion reactors energy is produced with tritium as intermediate step: Thermal neutrons fission lithium to produce tritium which in turn is fused to produce the major amount of energy.
Fission and fusion reactors differ in their multiplication processes: In fission the fuel is multiplied by producing long lived actinides. In fusion the neutrons are multiplied in beryllium, bismuth or lead to produce enough tritium. The half lives of the involved activation products in both processes (Be, Bi, Pb in fusion and Am, Np, Pu in fission) are similar.
The volumes of high level fission and fusion reactor waste that have to be disposed of after the generation of the same amount of thermal energy in both types of reactors are about the same, roughly one cubic centimeter of solid material per kW yr, if the comparison is limited to the volume of the fuel elements on the one hand and that of the first wall on the other. This is one of the reasons why in this paper the activities and potential hazards will be normalized to (i.e. given for) one cubic centimeter of reactor material.
This paper will identify critical elements likely to be present in activated steels, in the moderator graphite and multiplier materials. Graphs will show which of the activated elements will dominate the groundwater hazard for what period of time after shutdown of the reactor, i.e. for how long they will need to be isolated from the biosphere.
Construction of Blanket and Shield
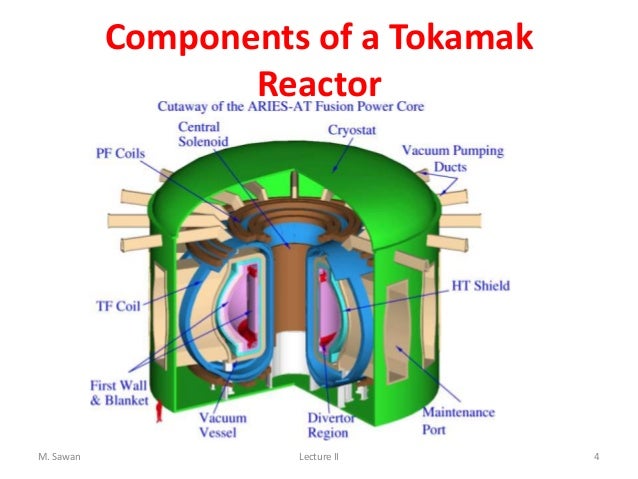
In order to give an impression of what the radioactive parts will look like, the arrangement of the blanket and shield around the plasma is shown in the next three figures, taking as an example the INTOR ("International Tokamak Reactor").
INTOR, the precursor to ITER, was
- the first truly international effort to develop a large experimental fusion reactor, started in November 1978 in the framework of the International Atomic Energy Agency.
- a workshop of European, Japanese, US and USSR scientists and technicians during late 1970s. It belonged to the group of intermediate devices that was supposed to be operable by the turn of the century, between the 1970s fusion experiments like the Tokamak Fusion Test Facility in Princeton, New Jersey, USA, and demonstration reactors (like ITER) that are supposed to show the technological feasibility to generate energy by fusion.
- never reached the Design Phase, and was eventually folded into the new ITER project in the autumn of 1987. ITER's figures in the second decade of the 21. century are not that different from those of INTOR.
In the blanket of INTOR a thermal power of 500 MW was supposed to be generated.
INTOR: Simplified Cross Section (after Abdou et al.)
|

The primary functions of the blanket in a fusion reactor is to convert the energy of the (14.1 MeV) fusion neutrons into heat and to breed tritium (H3) in Li-6(n, α) H3 reactions capturing thermal neutrons. The technical realisation must meet several additional requirements, e.g. adequate tritium recovery and acceptable safety and environmental impact. This is the reason why generating one tritium nucleus per (14.1 MeV) neutron released from one deuterium-tritium fusion reaction is not readily achieved. In other words: The thermal neutron flux seen by Li6 is at most equal to the flux of (14.1 MeV) neutrons (see below).
(Source of the figure: Slide 4 of Sawan, 2013)
|
Figure 1: Visualizations of INTOR and a generic Tokamak reactor
|
In Tokamaks the plasma is confined by magnetic forces to a horizontal torus. In Fig. 1 one can see the right half of a vertical cross section through the torus and its surrounding parts. The figure shows the first wall, blanket and shield. Through the openings in the blanket the plasma will be heated. The torus is built of an array of wedge-shaped sectors, one of which is shown in Fig. 2.
|

|
|
INTOR sector: First wall, blanket and shield (after Abdou et al.)
|
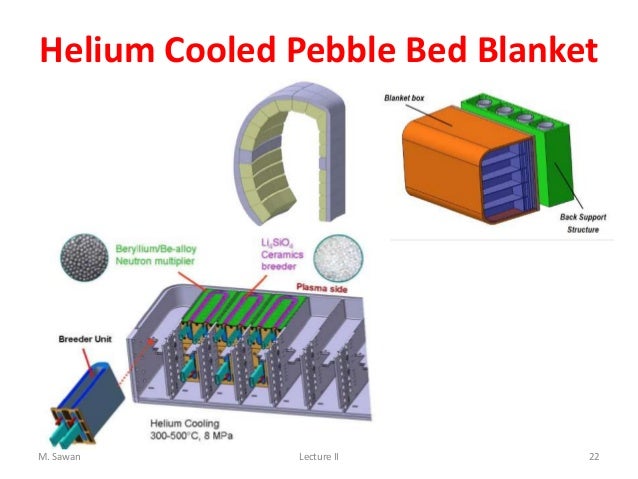
Generic Tokamak reactor: details of a helium cooled pebble bed blanket. Top left: sector of reactor torus, top right: blanket box and support structure (the highlighted part of the sector), bottom left: composition of blanket box.
(Source: Slide 22 of Sawan, 2013)
|
Figure 2: Tokamak toroidal sector
|
The blanket itself is composed of modules (see right part of Fig. 2 and Fig. 3).
Neutron Flux
The amount of activity generated by a neutron flux depends on its spectrum, i.e. the number and energy of neutrons in the flux. Although the neutron spectra of various fuson reactor designs (examples: Figs. 1 and 2 in Abdou, 1982) differ considerably (examples: Figs. 6a,b, 7a,b) in Abdou, 1982) they also have common features, which reflect the compromise between the technologically possible and the economically desirable.
- 14 MeV-neutrons. 14 MeV-neutrons are produced in the plasma chamber. Economics calls for a high power output of the reactor, i.e. of the order of several thousand Megawatts. Engineers, on the other hand, want the dimensions of the plasma chamber to be as small as possible. These demands taken together drive up the neutron flux that penetrates the first wall. Material scientists predict the failure of a steel wall after a critical exposure of several Megawatts-yr per m2 (1 MW = 4.5 x 10¹⁷ (14.1 MeV neutrons) per second). Today the neutron flux chosen is several MW/m2 (slide 5 of Kessel, 2014), which implies a short lifetime of the first wall, i.e. one or two years of plasma operation.
- Slow neutrons. Within the blanket, 14 MeV-neutrons are moderated by graphite, producing slow neutrons that are absorbed by lithium to produce tritium. Slow neutrons do not cause excessive radiation damage. Blanket designers maximize that flux by optimizing the balance between fast neutron moderation on the one hand and absorption and leakage of slow neutrons on the other. The slow neutron flux is likely to range between 1012 and 1013 neutrons per cm2 per second. Those high fluxes are seldom apparent in blankets, though, since - if technically possible- lithium is placed wherever such high fluxes appear, to maximize production of tritium.
Since the neutron flux varies by orders of magnitude within the blanket, the activation (generation of radioactive isotopes) of the reactor materials strongly depends on the reactor design and the location within the reactor. The reactor part the activation of which depends least on these factors is the first wall. This paper will therefore mainly deal with its activation.
The interior of the blanket will contain neutrons that have not yet been well moderated, i.e. which have energies a little too high to effectively split lithium atoms. And there will be 14 MeV-neutrons that have been elastically reflected from the nuclei of the blanket (near the first wall their number is about equal to the number entering from the side of the plasma). All those additional neutrons need to be considered in accurate activation calculations [Gruber, 1977, Gruber et al., 1977, and 1979]. In this paper they will be neglected for three reasons
- they do not lead to different radioisotopes than the ones considered,
- their contribution depends on the design of the reactor, and the optimum design is still in process of development, and
- only the order of magnitude of the activity of the high level radioactive waste coming from fusion reactors is relevant, today.
Within the range of the above mentioned upper limits of the two neutron fluxes (1.) and (2.), the amount of waste with half life longer than 10 years considered in this paper generally increases proportionally to the number of incident neutrons - the exceptions will be pointed out below. Therefore
- the flux of 14 MeV-neutrons, can arbitrarily be assumed as
Φ14 = 4.5 x 1013 cm-2 s-1 ,
corresponding to 1 MW/m2, and
- the flux of thermal neutrons is assumed to be equal to the 14 MeV-neutron flux:
Φth = 4.5 x 1013 cm-2 s-1 .
Neutron Activation Reactions
For the meaning of symbols (except the chemical symbols) see Notation section at the end of this paper. In Table 1 the elements are specified which appear in amounts higher than traces in the blanket.
In principle, in an individual activation reaction the number Δn of waste nuclei ("daughters") generated during an operation time Δt of the reactor is proportional to both the number Φ Δt of the incident neutrons (per area of the neutron flux) and the number n of exposed nuclei ("mother" nuclei). The ratio Δn/(n Φ Δt) is called the neutron activation cross section σ. It has been determined directly by experiment or calculated with the help of a nuclear model which correlates the basic properties of the nucleus, such as the number of protons and neutrons and their individual sizes, with the size of the nucleus and the chance of a nuclear activation reaction.
Reaction cross sections for fast neutrons have thresholds at about 10 MeV (examples: Fig.2 - Fig.7 in Yu Baosheng, Evaluation of Activation Cross Sections for (n,2n) Reactions on Some Nuclei" - in cache). So they use only a small part of the high-energy neutron flux. This is why in this assessment instead of the entire neutron spectrum (Figs. 1 and 2 in Abdou, 1982) only the neutron flux peak at 14 MeV will be used.
The activation cross sections for most thermal neutron reactions used here are from the German Chart of the Nuclides. The rest of the cross sections have been taken from a compilation of Alley and Lessler. They were used in the PLOWSHARE project for calculating the activity induced in soil by peaceful nuclear explosions.
As the compilation gives σ-values for most of the nuclides, even radioactive ones, it is a useful data base for activation calculations of the kind presented in this article. On the other hand many of its σ-values have been determined using the above mentioned nuclear structure theory, and therefore a discussion of possible variations of the activities is necessary. This is greatly eased by a linearization of the activation calculations: Except in the reactions given in Table 2, the number n of mother nuclei will be assumed to change only insignificantly, i.e. Δn/n = σ Φ Δt is assumed to be small. As long as the cross section σ is of normal size, i.e. below 10-23 cm2 = 10 barn this is guaranteed by the technical constraints to the number Φ14 Δt of 14 MeV neutrons entering each squaremeter of the first wall. They keep Φ14 Δt below several MWyr/m2 and Δn/n below several percent. (q is a linear function of all parameters)
The neutrons penetrating the initially non radioactive blanket react with the stable nuclei, thus yielding a first generation of new nuclei, called daughters. Those, in turn, are exposed to the neutrons, they act as mothers for a second generation of daughters, and so on. The sequence of generations is called an activation chain.
Because of the exponential decay of radionuclides with time it is not possible to accumulate radioactive nuclei in any generation during a period Δt longer than roughly their half life T. Thus the number of radioactive daughter-nuclei cannot become larger than Δn = n σ Φ T, which is less than 1 millionth of the number n of mothers if the reaction cross section lies in the normal range and the half life is of the order of hours. Such radionuclides terminate the activation chain, i.e. in the next generation of the chain the number of particles will be negligible compared with the number of first generation daughters or even the number of atoms of a trace impurity.
An investigation of the chart of the nuclides shows that we can expect a very large fraction of all known long-lived radionuclides (T > 10 yr) to appear in the blankets in the first generation of activation chains if we assume at least traces of each of the 83 elements to be present in the blanket materials. In a few cases the long-lived radionuclide does not appear among the first generation of daughters but instead a short-lived radionuclide takes that place. But after its formation it decays entirely yielding the long-lived waste nuclide. Therefore in the calculations these cases can be handled without loss of accuracy by neglecting the intermediate short-lived nuclide and assuming that the activation of the mother leads directly to the long-lived waste nuclide. An example is the reaction Mo100(n,2n)Mo99 which has a half life of 2.8 days. All of the decays end in Tc99 which has a half life of 2.1 x 10⁵ yr. This reaction will therefore be referred to as Mo100(n,2n)Tc99.
Data and Definitions
Table 1a. Elements Present in Larger than Trace Amounts in Stainless Steel
(see also Table II in Radiological Characterization of Shut Down Nuclear Reactors for Decommissioning Purposes, TECHNICAL REPORTS SERIES No. 389), 1998 (in cache)
| Element |
Concentration
w
(mg of element per kg of steel)
|
| Al |
5 102 |
| As |
3 102 |
| B |
10 |
| Co |
5 102 |
| Cr |
1.8 105 |
| Cu |
103 |
| Fe |
6.3 105 |
| Mn |
2 104 |
| Mo |
2 104 |
| Nb |
5 102 |
| Ni |
1.4 105 |
| P |
2 102 |
| S |
102 |
| Si |
7 103 |
| Ta |
2 102 |
| Ti |
102 |
| V |
2 103 |
| C |
6 102 |
| N |
102 |
| O |
2 102 |
Table 1b. Elements Present in Larger than Trace Amounts in Moderator Graphite
| Element |
Concentration
w
(mg of element per kg of graphite)
|
| N |
3 101 |
| O |
3 102 |
All other elements are arbitrarily taken to be present as traces of 1 mg per kg of structural, multiplier or moderator material. Furthermore beryllium is assumed to be used as oxide (beryllia) and lead, bismuth and graphite without additional metals or binders.
The calculations specify the (henceforth called "normalized") activities q (units: Ci/cm3) generated in 1 cm3 of blanket material, i.e. 1 cm3 of steel, 1 cm3 of BeO, 1 cm3 of Bi, 1 cm3 of C and 1 cm3 of Pb:
(eq. 1) ..... q = n σ Φ Δt λ / F
(see Notation section for meaning of n, σ, Φ, Δt , λ, F)
(eq. 2) ..... n = f NA ρ w / M
(meaning of f, NA,
ρ , w, M)
Number n of mothers with high neutron capture cross sections
The cross sections influencing the generation of Sm151, 152, Eu150,152,154, Hf178*, Irl92*, 193, 194 are very large (Table 2): Mothers or daughters have a large tendency to capture the thermal neutrons. Instead of being the constant value n = f NA ρ w / M, their numbers decrease rapidly during reactor operation, i.e. their n depends on the reactor operation time t: n = n(t). To simplify things, one can assign them an "effective" half life
(eq. Teff) ..... Teff = ln2/(σ Φ)
(meaning of σ, Φ, ln2)
which is defined analogously to the radioactive decay time T = ln2/λ. Teff is the time during which their number decreases by a factor of 2.
Table 2. Cross Sections and Effective Half-Lives of Mothers Involved in Nonlinear Activation Calculations, i.e. when number of mother isotopes decreases by a factor of 2 during Teff
(a: effective half life determined by reaction in next line)
(more cross sections, half-lives, Annual Limits of Intake, Maximum Permissible Concentrations, concentrations in biosphere water bodies)
| Mother (n,x) Daughter |
Cross Section
(barn)
|
Eff. Half Life of Mother, Teff
(yr)
|
| Sm150(n,g)Sm151 |
1.0 102 |
4.9 |
| Sm152(n,g)Sm153 |
2.1 102 |
2.3 |
| Sm151(n,g)Sm152 |
1.5 104 |
3.3 10-2 |
| Eu151(n,g)Eu152 |
4
3.3 103
5.9 103
|
5.3 10-2 |
| Eu151(n,2n)Eu150 |
6.1 10-1 |
8.1 102 |
| Eu153(n,2n)Eu152 |
7.6 10-1 |
a |
| Eu153(n,g)Eu154 |
3.9 102 |
1.3 |
| Hf177(n,g)Hf178* |
1. 10-7 |
a |
| Hf177(n,g)Hf178 |
3.7 102 |
1.3 |
| Ir191(n,g)Ir192 |
9.2 102 |
5.4 10-1 |
| Ir192(n,g)Ir193 |
1.1 103 |
4.5 10-1 |
| Ir193(n,2n)Ir192* |
5.9 10-1 |
a |
| Ir193(n,g)Ir194 |
1.1 102 |
4.5 |
To deal with this situation, I will use a similar simplification as the one mentioned above: When the number n of the mother is fairly constant, the number of daughter nuclei increases only during an operation time roughly equal to the half life of the daughter.
Similarly, in the case of rapidly depleted mother nuclei, I will assume the activation reactions come to an end when the mother has disappeared. This happens roughly after one half life Teff of the mother.
So, the activities for the radionuclides in Tab. 2 have been calculated taking into account these effects by simplifying the number n(t) of mothers to be used in eq. 1 as
n(t) = f NA ρ w / M ..... for reactor operation times t < Teff (see eq. 1)
n(t) = 0 ..... for reactor operation times t > Teff
Q is the activity of the entire blanket material, i.e. Q = Q1 for the first wall with volume V1, and Q = Qm for the neutron multiplier or moderator with volume Vm:
(eq. 3) ..... Q1 = V1 q
(eq. 4) ..... Qm = Vm q
Biological Hazard Potential
Since the activity q (Ci/cm3) does not include a measure of the radiotoxicity of a radionuclide, a quantity called "biological hazard potential" has been introduced (BHP, unit m3 of drinking water contaminated by entire reactor). The philosophy behind the definition of the biological hazard potential is as follows:
The metabolism of radionuclides in the so-called reference man has been formulated in models based on which the maximum permissible concentrations of radionuclides in drinking water for occupationally exposed workers (MPC) have been calculated. The International Commission on Radiological Protection (ICRP) recommends that the general public receive only 10% of the dose of the occupationally exposed population.
According to the definition of MPC, consumption of V = 0.8 m3 of water with a concentration 0.1 MPC will cause a radioactive burden ("population dose") of 0.5 rem which is supposed to be independent from the distribution of the water over the population: If one person drinks the whole 0.8 m3 she receives the dose of 0.5 rem. If she shares some of the water with another person her radiation burden is correspondingly less, (0.5 - x) rem, while the other person receives the x rem.
The definition of the potential biological hazard (BHP)
(eq. 5) ..... BHP = Q/(0.1 MPC)
(eq. 5a) ..... bhp = q/(0.1 MPC)
implies
- that perhaps the entire radioactive inventory has entered a population's drinking water supply,
- but that no radionuclide concentration exceeds 0.1 MPC, i.e. the dilution of the radioinventory provides sufficient protection for each individual of the public.
The BHP is the volume of such a drinking water body carrying the radioactive inventory Q. Due to the low dose rates, the population dose, dosemax, is assumed to be independent from how many people are actually exposed to the inventory Q. In this sense, the BHP gives us a measure of the maximum dose, dosemax(Q), an inventory Q of a radionuclide can cause in a population:
(eq. 6) ..... dosemax(Q) = BHP/V 0.5 rem = Q/(0.1 MPC V) 0.5 rem.
Let us use
(eq. 7) ..... BHPref = V = 0.8 m3
as a reference level against which to measure actual BHP's.
Thus, an actual BHP = n BHPref means a maximum population dose dosemax = n 0.5 rem.
The potential amount of contaminated drinking water BHP decreases exponentially with time t after shut-down of the reactor according to the radioactive decay law:
(eq. 12) ..... BHP(t) = BHP exp(- λ t)
where BHP is the hazard potential of a radionuclide X at shut-down of the reactor and λ = ln2/T is the radioactive decay constant of X.
The isolation time tisBHP can be defined as the time t at which
(eq. 13) ..... BHP(t = tisBHP) = BHPref.
In Figs. 4a and b we will display the BHP's of 1 cm3 of first wall or neutron multiplier material, and so we will normalize the reference BHP accordingly by dividing BHPref by the volume of the first wall, V1, or of the multiplier material, Vm:
(eq. 8) ..... bhp1ref = BHPref / V1 for the first wall
(eq. 9) ..... bhpmref = BHPref / Vm for the neutron multiplier or moderator.
In the following figures (Figs. 4a and b)
- the position of the normalized bhp's relative to the normalized reference levels bhp1ref (upper border of shaded area) and bhpmref (lower border of shaded area) and
- the time t at which normalized bhp(t) equals these normalized reference levels
will be visualized. The reference levels, the activities and the bhp's are consistently normalized. So both the distances of the bhp's above the reference levels and the times t are independent from the normalization.
Figs. 4a and b show that over millenia many BHP's are large enough (106 ... 7 m3) to represent the drinking water supply of a local population.
Quality of Radiological Data
After a shift in the philosophy of the ICRP, the concept of the MPC value has been replaced by the concept of the Annual Limits for Intake (ALI). A superscript o attached to some symbols in Table 3 (which contains all the results) indicates that the older MPC values were used to calculate the potential hazard, because the ALI values were not yet available.
Furthermore, the MPC = 3 x 10⁻⁵ Ci/m3 assigned to some radionuclides (symbols with !-mark) in Figs. 4 and 5 is not based on their specific behavior in the human metabolism. It had to be used for those radionuclides according to the general rule given by the ICRP, stating that for nuclides for which no MPC-values have yet been specified, the value 3 x 10⁻⁵ Ci/m3 - given for an "unidentified" radionuclide - should be used. It can be expected that the ALI-values that will be published in the future will correspond to higher MPC-values for those nuclides.
In this paper, MPC is calculated from ALI as follows:
(eq. 14) ..... MPC = ALI/V
where
V = amount of drinking water of man (0.8 m3/yr),
ALI = Annual Limit of Intake by workers (Ci/yr),
if ALI is given by the ICRP (USNRC compilation 10 CFR Part 20, Index of Radioisotopes ) or by Adams et al.. If ALI is not provided there, the old MPC value is taken. A source not used in these calculations is 10 CFR Part 20 "Standards for protection against radiation", Appendix B - Radionuclide Table - Index of Radioisotopes.
Natural Geochemical Isolation of Radionuclides: The Specific Activity Concept
We know that geological transport processes disperse as well as accumulate elements (the latter processes have formed ore deposits such as the uranium deposits Ortoleva et al. described). Life has developed in niches these processes have generated in the generally toxic environment of the earth. In this sense the processes have generated natural geochemical barriers protecting the biosphere against toxic inventories.
This assessment addresses the question: Would natural geochemical barriers similarly protect us against the radioactive inventories generated in fusion reactors once they have entered the environment?
In this assessment, therefore, we consider the following scenario:
- Man made barriers enclosing activated fusion reactor waste have failed and the radioactive inventories have become part of the environment.
- Over the centuries activated reactor waste inventories have formed secondary repositories [Gruber and Leckie, 1987, Gruber, 1990] within the biosphere.
- At some point in time these repositories are rapidly remobilized and the resulting waste element concentrations in water are
- limited by local geochemical processes such as precipitation and adsorption and
- -for the purposes of this assessment- well enough approximated by the maximum concentrations ce found in the environment.
- Isotopic dilution is negligible, meaning that the inventory of element X of reactor origin is only negligibly diluted in the pool of the natural element X simulataneously present at the site of the secondary repository.
|
The specific activity of reactor waste element X is the activity (Ci) of one gram of the activated element X. In the case of negligible isotopic dilution, the specific activity of an element X in drinking water is nearly the specific activity of that element in the reactor blanket. When in the reactor only one radioisotope of element X is generated, the specific activity S of X is
(eq. 15) ..... S = f NA/M σ Φ Δt λ/F = q/(ρ w)
(see Notation section for meaning of
f, NA, σ, Φ, Δt, λ, F, M, q, ρ , w). The denominator, ρ w, is the weight of X in 1 cm3 of blanket material.
If the activity of element X results from a number of radioisotopes, we take the sum over all radioisotopes.
The specific activity of non stable elements, such as Tc, or Pu239 is
(eq. 15a) ..... S = NA λ F / M,
where M is the weight of 1 mole of the non stable element, for example MTC99 = 99 g, MPu239 = 239 g.
Now we can define cp, the required concentration limits of an element X from the reactor in drinking water of the public:
(eq. 16) ..... cp = 10-1 MPC/S = 10-1(ALI/V)/S,
where the factor 10-1 appears because the maximum permissible concentration of a radionuclide in drinking water of the public is 0.1 MPC.
Geochemical Barriers
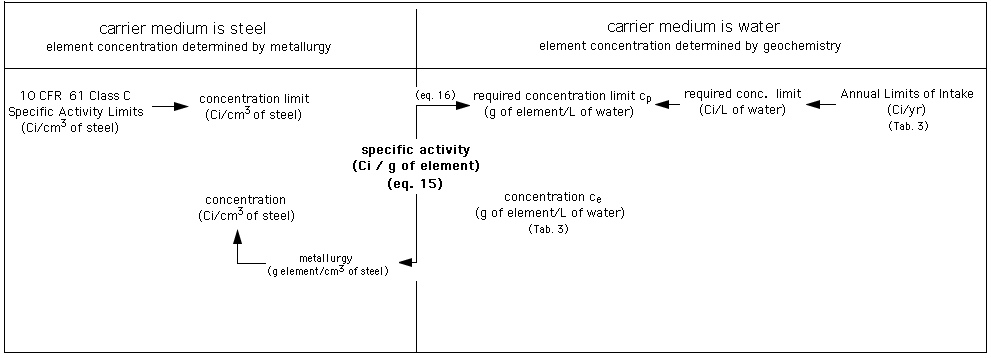
Diagram: Assessment of required isolation of elements activated in the fusion reactor first wall. Left part of diagram: radwaste burial in shallow land disposal site according to 10 CFR 61 [Fetter et al., 1988, 1990]. Right part of diagramm: radwaste elements have become subject to long-term natural geochemical processes and indistinguishable from natural elements.
It will be investigated from what time t after reactor shutdown onward natural geochemical barriers represented by ce will protect the human food chain from radioactivated elements.
Let us assume that the highest observed concentrations ce of elements X in groundwater compiled in Drinking Water and Health, 1977 are sufficiently close to the saturation limits provided by the geochemical barriers.
The geochemical barrier is effective against a radioisotope X* of element X if at some time t after reactor shutdown
(*)
cp(t = tisc) = cp exp(-ln2 (tisc/T)) = ce
where cp is the concentration limit of element X at shutdown (t = 0) of the reactor and T is the half life of the radioisotope X*. In that sense, the necessary isolation time of fusion reactor waste with a hazard below the limit BHPref can be defined as t = tisc that meets the isolation condition (*):
tisc= T ln (ce/cp) / ln2.
In Figs. 5, tisc is the abscissa of the intersection of a decay curve with the corresponding environmental level ce.
Results
The assessment of the fusion reactor waste activities Q is based on two complementary evaluations:
- Figs. 4 will rank the radioisotopes by potential population dose dmax(Q), thus visualizing which or when hazards are negligible.
- Figs. 5 help to find radionuclides the environmental concentrations ce of which in drinking water might exceed the limiting levels cp.
The concentration limit cp is independent from the size of the reactor, as long as the above discussed premises of the specific activity concept are met.
Obviously the activity Q and the potential biological hazard BHP depend on the size of the reactor, which is still subject to changes. Therefore, normalized values q and bhp have been calculated and plotted. To arrive at the potential hazard originating from an complete decomissioned fusion reactor, one needs to scale q and bhp by the number of cubic centimeters of blanket material present in the entire reactor.
As pointed out above, the total amount of first wall material is fixed
- by the technological limit to the 14 MeV-neutron flux (several MW/m2) the first wall can withstand and
- the optimum power output of a reactor from the point of view of economics (500 MW or more),
the thickness of the wall being bound by stability conditions to vary only little about the value of 5 mm.
So
- the first wall of a fusion reactor will have a volume
V1 of several cubicmeters,
- the neutron multiplier and the neutron moderator will have a volume Vm approximately 10 times as large, because its thickness, and thus also its volume, is by about a factor of 10 larger than the first wall (see Fig. 3).
Accordingly,
- the total activity Q of long-lived waste and
- the total potential amount BHP of contaminated drinking water (level 0.1 MPC)
are about six to seven orders of magnitude higher than the normalized values q and bhp plotted in Figs. 4 and 5 in the Table (Q = 106 ... 107cm3 q, and correspondingly BHP = 106 ... 107 cm3 bhp).
For example, the volume BHPNi63 of drinking water that can potentially be contaminated by the inventory of Ni63 at shut-down of the reactor is of order 108 - 109 m3 .
Figures 4 and 5 are combined plots, in the sense that they present
- measures of the hazard at shutdown, i.e. bhp and cp, as well as
- the deacy of the hazards with time t after shutdown of the reactor.
The hazards bhp and cp at shutdown are plotted vs. their radioactive half lives T by placing the chemical symbol of the radioactive element (mother and daughter) at the locations {x = T, y = bhp} and {x = T, y = cp}, respectively.
The plots of bhp(t) and cp(t) show which radionuclide dominates the hazard at a given time after reactor shutdown. Obviously, these plots can be generated from the bhp(T) and cp(T) plots by replacing each chemical symbol with a decay curve of the form given for BHP(t).
To avoid clutter, basically only the prominent decay curves were added to the bhp(T) and cp(T) plots. The total bhp(t) or cp(t) (summed over all activated elements) would look very much like the canvas of a tent being fixed below the prominent radionuclides like a canvas hanging from tent poles.
The reference level V is the upper (V/V1) or lower (V/Vm) border of the shaded area in Figs. 4 a and 4b.
For first wall materials the distance of an element bhp from the line V/V1, i.e.
log d = log bhp - log (V/V1) = log bhp/(V/V1)
gives the factor between the reference dose 0.5 rem and the population dose dosemax(q) due to that element:
dosemax / (0.5 rem) = BHP/V = bhp1/ (V/V1)
thus
dosemax = bhp/(V/V1) 0.5 rem
These are the populations doses dosemax listed in Tab. 4.
Detailed results are displayed in Tab. 3 (in the Appendix).
Figs. 4 display the biological hazard potentials in normalized form, i.e. for 1 cm3 of blanket material or fission fuel, such that they can be scaled according to design needs and data improvements, such as
- blanket dimensions,
- blanket compositions,
- choice of blanket materials, including their trace impurity content,
- changes in the radiological data,
assuming that (1) - (3) does not significantly affect the activating neutron spectra. This assumption is acceptable since we discuss only the orders of magnitude of the radwaste problem.
|
Example for use of figure:
At fusion reactor shutdown the bhp of Be10 in the multiplier (with a half-life T of approximately 2 million years) is 7 10-1 m3/cm3 (see Tab. 3A).
- This is about 7 orders of magnitude higher than the reference bhpmref = 8 10-8 (lower boundary of shaded area).
- The BHP of the total inventory -not just 1 cm3 of it- is bhp Vm = 7 106 m3.
- The population dose associated with the entire Be10 inventory is:
BHP 0.5 rem / V = BHP 0.5 rem / (0.8 m3) = 4.4 106rem.
- After shutdown the population dose due to the Be10 inventory remains millions of rem for millions of years, after which it decays as exemplified by the associated dashed curve below the letters "Be!".
|
Figure 4a. Biological hazard potentials (ingestion pathway), bhp, associated with 1 cm3 of reactor material. The inventories have been generated by the thermal neutron activation reactions given in Table 3A together with a reactor energy output of 1 GWthyr.
- Irradiation data:
- fusion reactor
- 1st wall load: 1 MW/m2 = 4.5 x 10¹⁷ neutrons per second,
- neutron flux is fixed to the same value throughout the entire blanket, including the first wall: Φ14 = 4.5 x 1013 cm-2 s-1 (flux of 14 MeV, "fast", neutrons) = Φth (flux of thermal neutrons). Since activation is proportional to the neutron flux, results can easily be scaled according to the actual neutron flux.
- assumed volume of first wall: 106 cm3
- assumed volume of neutron multiplier (Vm): 107 cm3
- assumed volume of neutron moderator (Vm): 107 cm3
- fission reactor fuel (uranium oxide):
- fuel burn-up: 30 GWtd/tHM
- amount: 12 t of heavy metal corresponding to 6 105 cm3 (VHM).
- composition of fusion reactor material:
- stainless steel and graphite constituents: Tables 1a and 1b.
- All other elements are arbitrarily taken to be present as traces of 1 mg per kg of structural, multiplier or moderator material.
- Furthermore beryllium is assumed to be used as oxide (beryllia) and lead, bismuth and graphite without additional metals or binders.
- Legend:
- bhp is represented in a combined plot:
- element symbol plot: bhp(T), i.e. the bhp at reactor shutdown of any radioisotope as a function of the half life T of that radioisotope,
- line plot bhp(t) = bhp(T) exp(-λ t), i.e. the bhp of a specified radioisotope plotted vs. the time t after reactor shutdown. Solid lines: results for stainless steel,
short dashes: results for neutron multiplier,
long dashes: results for moderator graphite.
- Two chemical symbols next to each other represent a transmutation reaction, e.g. MoNb represents the Mo->Nb transmutation. The pair MoNb is located at {x = T, y = bhp} of Nb.
- Shades areas
- vertical area (named "Tritium"): Roughly during the shaded time period after reactor shutdown, fusion reactor hazard potential is probably dominated by the inventory (roughly 1 kg) of the reactor fuel, tritium (H3). Because hydrogen is an intrinsic part of the biosphere, its radioisotope tritium is a major fusion related hazard:
- Total inventory (1 kg) Q = 107 Ci,
- BHP = 6 108 m3 water (basis)
- bhp = 102 m3 water / cm3 blanket material (10 m3 of blanket material assumed) (basis).
For comparison: The world wide production of tritium from natural sources is 4 106 Ci per year with a steady state inventory of about 7 107 Ci [Idaho State University, Radiation Information Network's Tritium Information Section, in cache)].
Note: The fusion reactor is essentially a breeder reactor: The entire reactor fuel (tritium) is bred within the fusion reactor blanket and needs to be extracted from it by an elaborate and not yet developed reprocessing technology. Present day fission fuel reprocessing plants release the greater fraction of the tritium inventory from the fuel into the biosphere.
Thus, apart from the operational safety associated with tritium (steel is permeable for hydrogen at the fusion reactor operating temperatures) the tritium bound physically (i.e. adsorbed on material surfaces) as well as chemically to the reactor materials poses a major disposal problem.
- horizontal area shows the (normalized) reference biological hazard potential
- upper border = bhp1ref = BHPref (unit: m3 water) / V1 (unit: cm3 first wall material) = 8 10-7 m3/cm3,
- lower border = bhpmref = BHPref (unit: m3 water) / Vm (unit: cm3 multiplier material) = 8 10-8 m3/cm3.
- ! mark added to those element symbols where MPC of unidentified radionuclide has been used for calculation instead of specific radionuclide data which were not available at the time this paper was written
- Notes:
- For activation products of Be, Er, Ho, Sm (marked by !) MPC = 3 10-5 Ci/m3 (unidentified radionuclide) had to be used in the absence of better data.
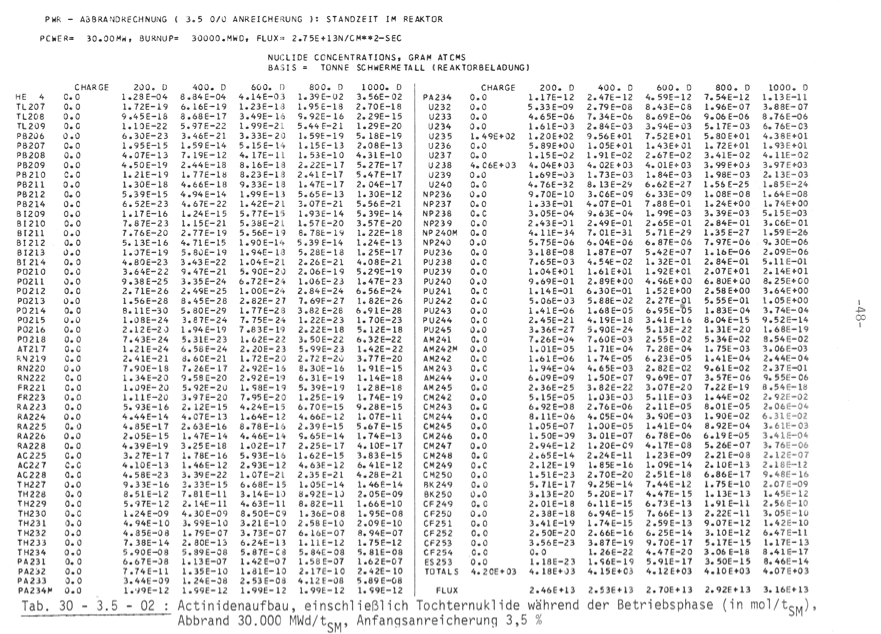
- Actinides (Am, Np, Pu) generated in fission reactor fuel are included for comparison. bhp's of actinides were calculated from activities q (see definition of bhp) generated with ORIGEN computations (see results in cache, Source: p 48 of R. Gasteiger, Calculation of burn-up data for spent LWR-fuels with respect to the design of spent fuel reprocessing plants, KfK 2373, Institut für Angewandte Systemanalyse, Projekt Wiederaufarbeitung und Abfallbehandlung, Gesellschaft für Kernforschung, November 1976).
- The bhp's of fission products and more actinides (units: m3/cm3) can be estimated from the population doses dkamil (units: Sv/tHM) in Figure 2.5a of Kamil by multiplying Kamil's numerical values with 3.04 10-3:
bhp(this plot) = dkamil V / (0.5 rem VHM) (rem/(0.01 Sv)) = dkamil 3.04 10-3 m3/cm3 tHM/Sv
Instead of our burn-up (30 GWthd/tHM) Kamil uses 41.2 GWthd/tHM.
(see also Nuclear Energy Agency, Organisation for Economic Co-operation and Development, Fig. 1.2 of "Physics and Safety of Transmutation Systems - A Status Report", Nuclear Science, ISBN 92-64-01082-3, OECD 2006, in cache)
|
|
|
Figure 4b. Biological hazard potentials (ingestion pathway) bhp in 1 cm3 of reactor material generated by fast (14 MeV) neutron activation reactions given in Table 3B together with a reactor energy output of 1 GWthyr . For activation products of Al, Bi, Cl, Er, Eu, La, Mo, Nb, Sm, Tb (marked by !) MPC values for unidentified radionuclides had to be used for same reason as in calculations for Fig. 4a. Irradiation data. For more information see caption of Fig. 4a.
|
|
Interpretation of plot:
- At reactor shutdown, the concentration limit of Cl cp would be 8 10-5 g/L (see symbol Cl at abscissa T = 3 105 yr and ordinate cp = 8 10-5 g/L).
- With time t after shutdown the Cl activity decays, and thus the Cl concentration limit increases by the same measure (as exemplified by the solid curve associated with the symbol Cl).
- The solid curve intersects with the observed maximum Cl concentration level (1 g/L) at a decay time t = 2 106 yr. Thus, when the trace of Cl activated in blanket material is isolated from the environment for 2 million years, its activity has decayed to the concentration limit cp = ce.
|
Figure 5a. Concentration limits cp of blanket materials and some actinides from used fission fuel (combined plot as described above). Only thermal neutron activation reactions given in Table 3A have been considered. Reactor energy output = 1 GWthyr.
- Irradiation data.
- More information in caption of Fig. 4a.
- Reference concentration levels:
- elements in boxes associated with horizontal lines: maximum observed concentrations in environmental water, ce.
- For the Cl ion values ce in excess of 1 g/l are acceptable in drinking water.
- shaded areas:
- Encircled elements have a maximum population dose dmax(Q) < 0.5 rem.
|
|
|
Figure 5b. Concentration limits cp of blanket materials in a combined plot as explained above. Only fast (14 MeV) neutron activation reactions given in Table 3A have been considered. Irradiation data. For more information see captions of Figs. 4a and 5a.
|
Major results that can be extracted from Figs. 4 and 5 are presented in Tab.4 in non-normalized form.
Table 4. Summary of Results: Evaluation of Relevant Radionuclides (T > 50 yr, Population Dose dmax > 50 rem) in fusion and fission reactors having produced 1 GWthyr. Fusion reactor 1st wall load: 1 MW/m2 = 4.5 x 10¹⁷ neutrons per second, fission reactor fuel burn-up: 30 GWtd/tHM. (Details in Tab. 3). Compare these findings with [Fetter et al., 1988, 1990].
Activation Reaction,
Actinide
|
Half Life (year)
|
Population Dose dmax (rem)
for ALI, MPC
known ...... unknown
(1)
|
Is cp < ce?
Yes (+) or No (-)
for ce
known ...... unknown
(2)
|
Material, Fusion/Fission
Reactor
|
| Li6(n,a)H3 |
12.3 |
107 |
+ (3) |
steel, mult., mod., fus.& fis. |
| Ni62(n,g)Ni63 |
100 |
4 107 |
+ |
steel, fus.&fis. |
| Ni64(n,2n)Ni63 |
100 |
1 106 |
- (3) |
steel, fus.&fis. |
Ag107(n,g)Ag108*
|
130 |
6 103 |
+ |
steel, fus.&fis. |
Ir191(n,g)Ir192*
|
240 |
1 104 |
+ |
steel, fus.&fis. |
Ho165(n,g)Ho166*
|
1.2 103 |
2 104 |
+ |
steel, fus.&fis. |
| Mo92(n,g)Mo93 |
3.5 103 |
6 103 |
+ |
steel, fus.&fis. |
| Mo94(n,2n)Mo93 |
3.5 103 |
3 104 |
- |
steel, fus.& fis. |
| Mo92(n,2n)Nb91 |
1.0 104 |
6 104 |
+ |
steel, fus.& fis. |
| Nb93(n,g)Nb94 |
2.0 104 |
2 104 |
+ |
steel, fus.& fis. |
| Ni58(n,g)Ni59 |
7.5 104 |
1 104 |
- |
steel, fus.& fis. |
| Ni60(n,2n)Ni59 |
7.5 104 |
3 102 |
- |
steel, fus.& fis. |
| Mo100(n,2n)Tc99 |
2.1 105 |
5 103 |
+ |
steel, fus.& fis. |
| Cl35(n,g)Cl36 |
3.0 105 |
5 102 |
+ |
mod,fus.& fis. |
| Bi209(n,2n)Bi208 |
3.7 105 |
6 108 |
+ |
mult, fus.& fis. |
| Be9(n,g)Be10 |
1.6 106 |
4 106 |
- |
mult, fus. |
| Fe54(n,2n)Mn53 |
3.7 106 |
5 101 |
- |
steel, fus.& fis. |
| Al27(n,2n)Al26 |
7.2 106 |
4 104 |
- |
structure(4) fus.& fis. |
| Pb206(n,2n)Pb205 |
1.4 107 |
3 104 |
- |
mult, fus. |
| Am243 |
104 |
1 108 |
+ |
mult, fis. |
| Pu239 |
2 104 |
3 109 |
+ |
mult, fis. |
| Np237 |
2 106 |
1 106 |
+ |
mult, fis. |
Legend:
- column 3:
- known means: MPC or ALI of radionuclide available.
Population dose is entered on left side of column 3 when MPC or ALI are known.
- not known means: MPC for radionuclide not available and MPC of unidentified radionuclide used instead.
Population dose is entered on right side of column 3 when MPC or ALI are not known.
- column 4:
- known means: ce compiled in Drinking Water and Health,
+ or - is entered on left side of column when ce is known.
- non known means: ce not found in this reference.
+ or - is entered on right side of column when ce is not known.
- column 4 states whether or not natural geochemical barriers protect our drinking water ("biosphere") from the radionuclide considered.
- + means: at reactor shutdown we need barriers additional to the natural ones the keep cp < ce or cp < 10-4 g/l , i.e. biosphere is probably not protected by natural geochemical barriers alone. Protection without these additional barriers is arrived at only after the radionuclide has decayed sufficiently, i.e. after several half lives have passed.
- - means: natural geochemistry puts more stringent limits on the concentration than radiology: possible concentrations in drinking water ce are smaller than the concentration limits. In other words: already at reactor shutdown ce < cp or cp > 10-2 g/l , i.e. biosphere is probably protected by natural geochemical barriers.
- annotation 4: in advanced fusion reactor designs use of aluminium instead of stainless steel is being considered.
(1) Chlor ist ein Beispiel für eine Verunreinigung, aus der im Fusionsreaktor ein langlebiges Folgeprodukt (Cl36) entsteht. Im Fusionsreaktor aktiviertes Chlor muß etwa 1 Millionen Jahre von der Geosphäre isoliert werden:
Die Aktivierungsreaktion ist
Cl35 (n, g) Cl36, Halbwertszeit von Cl36 ist T = 3.0 105 Jahre.
Damit es wie natürliches Chlor mit dem Trinkwasser aufgenommen werden kann, darf es zum Zeitpunkt der Reaktorstillegung -wegen seines Cl36-Gehalts- nur in einer Konzentraton von weniger als cp = 8 10-5 g Cl pro L Wasser vorliegen. Natürliche Konzentrationen von Chlor liegen bei 10-3 ... 1 g/L. Fusionsreaktor-Chlor muß also mindestens für 3.6 T = 106 Jahre von der Biosphäre isoliert werden, bis es (in diesem Konzentrationsbereich) im Trinkwasser vorliegen darf.
(2) Molybdän ist ein Stahl-Legierungsbestandteil. Aus ihm entsteht Technetium (Tc). Im Fusionsreaktor entstandenes Technetium muß möglicherweise eine Millionen Jahre von der Geosphäre isoliert werden:
Seine Aktivierungsreaktion im Fusionsreaktor ist
Mo100 (n, 2n) Tc99, Halbwertszeit von Tc99 ist T = 2.1 105 Jahre.
Technetium darf wegen seiner Radioaktivität höchstens in einer Konzentration cp = 2 10-5 g Tc pro L Trinkwasser vorhanden sein (Anmerkung 6 in Tabelle 3 des Vergleichspapiers).
Weil Technetium kein natürliches Element ist, ist sein durch die natürliche Geochemie gegebener Konzentrationsbereich im Trinkwasser unbekannt. Natürliche Konzentrationen des chemisch ähnlichen Mangan (Mn) liegen 10-3 g/L. Würde Technetium in ähnlichen Konzentrationen im Trinkwasser auftreten, müßte Fusionsreaktor-Technetium 5.6 T = 1 106 Jahre von der Geosphäre abgeschlossen bleiben.
(3) Ein Fusionsreaktor ist immer ein Brüter (für Tritium). Damit die Neutronenbilanz ausreichend fürs Brüten ist, braucht man Neutronenvervielfacher. Wismuth (Bi) ist ein Kandidat, hat aber auch ein langlebiges Aktivierungsprodukt. Im Fusionsreaktor aktiviertes Wismuth muß 2 Millionen Jahre von der Geosphäre isoliert werden:
Seine Aktivierungsreaktion im Fusionsreaktor ist
Bi209 (n, 2n) Bi208, Halbwertszeit von Bi208 ist T = 3.7 105 Jahre, cp = 9 10-5 g/L Wasser. Wenn natürliche Wismuthkonzentrationen im Wasser bei 10-6 g/L liegen, muß Fusionsreaktor-Wismuth 6.5 T = 2 106 Jahre von der Geosphäre isoliert bleiben.
Conclusions
Due to their common features, fission reactors and fusion reactor designs today produce similar inventories of neutron induced activity (i.e. disregarding fission products) together with a given amount of energy.
Two independent quantities can be used to characterize the activity levels Q and the resulting isolation requirements:
- the maximum dose dmax(Q) measured in rem to which a population is exposed via the drinking water pathway when the radwaste is released into a reservoir. The population dose is also expressed as potential biological hazard BHP measured in m3 of potentially contaminated drinking water.
- the degree of necessary natural geochemical isolation of the radwaste. It is expressed as concentration limit in drinking water cp measured in g of activated element per liter of environmental water. cp is based on the concept of specific activity S, which is measured in Ci per gram of element.
The potential population dose decreases with time t after reactor shutdown. After it has fallen below an acceptable limit, natural geochemical processes become relevant. The engineered radwaste repository may start to release the waste inventory at time t when those natural geochemical barriers succeed to sufficiently limit the exposure of an individual of the population.
Biological Hazard Potential
Ni63 with half life T = 100 yr poses the highest hazard (population dose dmax = 4 107 rem). The longer lived fusion reactor hazard potential BHP(100 yr < T < 107 yr) is of order of magnitude 105 ... 108 rem, depending on the choice of the neutron multiplier material. The elements with relevant daughters in fusion reactor radwaste are
- in stainless steel: the long-lived isotopes of silver, nickel, molybdenum and iron. Potential population dose dmax = 104... 107 rem for 104 years.
- in neutron multiplier (beryllium, bismuth or lead. Which one is chosen is still open):
- Be10: population dose dmax = 4 106 rem, half life T = 2 106 years,
- Bi209: population dose dmax = 6 108 rem, half life T = 4 105years,
- Pb205: population dose dmax = 3 104 rem, half life T = 107 years.
The population doses of beryllium and bismuth are still unknown (see column "MPC unknown" in Tab. 4) because their radiological properties have as yet not been investigated. In view of the preliminary population doses, we can expect the neutron multiplier in a fusion reactor (about 10 m3 in INTOR) to pose a major long lived hazard, regardless of its eventually determined radiological properties.
For comparison: After a fission reactor has produced the same amount of energy as the fusion reactor has (1 GWthyr), the population doses dmax of the actinides Am, Pu and Np (104 yr < T < 2 106 yr) generated in fission reactor fuel are of the order of magnitude 106 ... 109 rem.
Natural Geochemical Isolation
The population doses originating
- from the long lived Ni59, Mn53 and Be10 are probably always contained (i.e. starting at reactor shutdown, t = 0) by the geochemical barriers in our groundwater (see - in column "ce known" in Tab. 4).
- from activated silver (Ag108*, population dose dmax = 6 103 rem) will be contained by this barrier after an isolation for tisc = 700 years.
Yet, for most of the activated elements with high dosemax this barrier has not been investigated (+ in column "ce unknown").
Especially for the neutron multiplier materials the radiological and environmental properties need to be investigated to quantify the extent to which fusion reactor waste is less problematic than fission reactor waste.
Using the data presented in Figs. 4 and Figs. 5 in the way described we find a mimimum isolation time of fusion reactor waste of about half a million years.
Notation
! = mark used on element symbols in Figs. 4 and 5 to remind of the fact that MPC of unidentified radionuclide has been used for calculation
ALI = Annual Limit of Intake of radionuclides by workers (Ci/yr), explanation
BHP = Biological Hazard Potential of entire reactor substructure (first wall, neutron multiplier, neutron moderator) at shutdown of the reactor (m3 drinking water), BHP and BHP(T) used interchangeably, first time used
BHP(t) = Biological Hazard Potential of entire reactor substructure (first wall, neutron multiplier, neutron moderator) t years after shutdown of the reactor (m3 drinking water), first time used
BHPref = V, first time used
bhp = ("normalized") biological hazard potential of 1 cm3 of reactor substructure at reactor shutdown (m3 drinking water contaminated by 1 cm3 of reactor substructure), bhp and bhp(T) used interchangeably, first time used
bhp(t) = ("normalized") biological hazard potential of 1 cm3 of reactor substructure t years after shutdown of the reactor (m3 drinking water contaminated by 1 cm3 of reactor substructure), first time used
bhpref = V/V1 for first wall material, = V/Vm for moderator/multiplier material, first time used
blanket material: 1 cm3 of blanket material means
- 1 cm3 of steel (first wall),
- 1 cm3 of BeO (neutron multiplier),
- 1 cm3 of Bi (neutron multiplier),
- 1 cm3 of C (neutron moderator) and
- 1 cm3 of Pb (neutron multiplier)
first time used
ce = upper limit of concentration found in environmental water body (g/L), first time used
charge = weight of the fission reactor fuel that produced 1 GWth yr with a burn-up of 30 GWth d / tHM (charge = 12.2 tHM), first time used
cp = concentration limit in drinking water at shutdown of reactor at reactor shutdown (g/L), first time used
cp(t) = concentration limit in drinking water t years after shutdown of reactor (g/L), first time used
dosemax(Q) = population dose when radioactive inventory Q is released to a population, first time used
dspec = specific ingestion dose coefficient, specified for
Δt = operation time of a blanket module (2 yr), first time used
F = conversion factor. F is the number of decays per year equaling 1 Ci, first time used
F = (3.7 1010 (decays/sec)/Ci) multiplied with the number of seconds per year (3.15 107 sec/yr): F = 3.7 1010 (decays/sec)/Ci * 3.15 107 sec/yr = 1.17 1018 decays per year equaling 1 Ci = 1.17 1018 Ci-1yr-1
f = fraction of mother isotope present in mother element, i.e. natural abundance of mother isotope, first time used
HM = the heavy metal constituting the fission reactor fuel. Here HM is enriched uranium, containing 3.7 % U235. first time used
λ = ln2/T (1/yr), first time used
λ/F (having the unit Ci) = ln2/(1.17 1018 (Ci yr)-1 T (yr)) = ln2/(1.17 1018 T), where T is entered in units of yr
ln2 = natural logarithm of 2 = 0.69
M = weight of 1 mole of mother element (g/mole), first time used
MPC = Maximum Permissible Concentration of radionuclides for workers, first time used
n = number of mother nuclei in 1 cm3 of blanket material (particles/cm3), first time used
NA = 6 1023 particles/mole, first time used
normalized quantity = quantity calculated for 1 cm3 of blanket material, i.e. 1 cm3 of steel, 1 cm3 of BeO, 1 cm3 of Bi, 1 cm3 of C and 1 cm3 of Pb. Note that the specific activity of element X is its normalized activity, q, divided by ρ w, the number of grams of X in 1 cm3 of blanket material. first time used
Φ = neutron flux, only 14 MeV-neutrons and thermal neutrons (Maxwellian distribution of energies for a moderator temperature of 25 C): Φ14 = 4.5 x 1013 cm-2 s-1 (for 14 MeV, "fast" neutrons) = Φth (for thermal neutrons), first time used
Q = activity of the
- entire fusion reactor blanket material (Ci), i.e. of the first wall, Q = Q1, and of the neutron multiplier or moderator, Q = Qm, first time used
- fission reactor fuel that produced 1 GWth yr.
Q' = Q/charge (first time used)
q = activity of 1 cm3 of blanket material (Ci/cm3), i.e. of 1 cm3 of stainless steel, 1 cm3 of the neutron multiplier material, beryllium, bismuth or lead, and 1 cm3 of the neutron moderator material, graphite, first time used
ρ = density of blanket material (g/cm3), steel: 7.7, beryllia: 2.5, Bi: 9.8, C: 2.3, Pb: 11.4. first time used
S = specific activity of an element X at reactor shutdown (Ci/g of the element), S = f NA σ Φ Δt λ / (F M), first time used
S(t) = specific activity of an element X at time t after reactor shutdown (Ci/g of the element), first time used
σ = activation cross section of mother isotope (cm2), first time used
T = half life of radionuclide (yr), first time used
Teff = effective half life of mother (yr), first time used
t = time after shutdown of reactor (yr), first time used
1 tHM = 1 ton of heavy metal (HM), i.e. of fission reactor fuel first time used
tis = necessary isolation time (yr), first time used
V = volume of drinking water consumed per year, (V = 0.8 m3), first time used
V1 = volume of first wall (several m3, in these calculations: V1 = 1 m3), first time used
Vm = volume of neutron moderator or multiplier (several 10 m3, in these calculations: V1 = 10 m3), first time used
VHM = volume of 1 ton of heavy metal (1 tHM), assuming a HM density of 18.9 g/cm3 : VHM = 5.3 104 cm3 per tHM, first time used for calculating biological hazard potential of 1 cm3 of fission reactor spent fuel.
w = weight of mother element in 1 g of blanket material (g/g), first time used
References
Abdou, M (in cache) et al. "INTOR - International Tokamak Reactor (in cache), Phase 1, Conceptual Design", Vol.III, EUR FU BRU/XII 2/81/EDV-50; IAEA-VIENNA; Commision of the European Communities, Director General XII - Fusion Programme: Brussels, Belgium, 1981.
(see also: Tillack, M.S. and the ARIES Team, Engineering Overview of ARIES-RS Tokamak Power Plant, Fusion Energy Research Program, University of California, San Diego, La Jolla, CA 92093-0417,19th Symposium on Fusion Technology, Lisbon, Portugal, 16-20 September 1996 (in cache)
Abdou, M.A., "Tritium Breeding in Fusion Reactors", ANL/PPP/TF--165, Argonne National Laboratory, 1982 (in Cache).
Abdou, M., "Tritium Breeding in Fusion Reactors", p 293-312 in: Proceedings of the International Conference on Nuclear Data for Science and Technology, 6-10 September 1982, Antwerp, K.H. Böckhoff (ed.), ECSC, EEC, EAEC, Brussels and Luxembourg, 1983.
Adams, N. et al. "Annual Limits of Intake of Radionuclides for Workers", NRPB-R82 Harwell; Didcot: Oxon, Great Britain, 1978.
Alley, W.E.; Lessler, E.M. Nuclear Data Tables 1973, 11, 621-825.
Bell, M.J., ORIGEN - "The ORNL isotope generation and depletion code", ORNL - 4628, Oak Ridge National Laboratory, Oak Ridge, Tennessee, 1973.
Council directive lying down basic safety standards for the protection of the health, Number 96/29/EUROATOM, 1996.
Drinking Water and Health, Volume 1, Safe Drinking Water Committee, National Research Council, National Academy of Sciences, Washington, D.C., 1977 (ISBN: 0-309-55400-4) (in Cache).
Driscoll, D.G. et al., Hydrology of the Black Hills Area, South Dakota, US Geological Survey, Water Resources Investigation Report 02-4094, 2002 (in cache).
EPA, 2012 Edition of the Drinking Water - Standards and Health Advisories,
EPA 822-S-12-001, Office of Water, U.S. Environmental Protection Agency, Washington, DC, Spring 2012 (in cache).
Fetter, S; Cheng E.T.; Mann, F.M., Long-term Radioactivity in Fusion Reactors, Fusion Engineering and Design 6, 123-130, 1988 (in cache). Steven Fetter: Email, Bio.
Fetter, S; Cheng E.T.; Mann, F.M., Long-Term Radioactive Waste from Fusion Reactors, Fusion Engineering and Design 13(2), 239-246, 1990 (in cache).
Salminen, R. (ed.), Foregs Geochemical Atlas of Europe, Part 1: Background Information, Methodology and Maps, Statistical Data of Analytical Results, A contribution to IUGS/IAGC Global Geochemical Baselines, 2005(in cache).
Gasteiger, R. "Calculation of burn-up data for spent LWR-fuels with respect to the design of spent fuel reprocessing plants", KfK 2373 (in cache), Institut für Angewandte Systemanalyse, Projekt Wiederaufarbeitung und Abfallbehandlung, Gesellschaft für Kernforschung, Karlsruhe, Germany, November 1976, pages 48, 54.
Gruber, J. "Evaluation of the Activity Levels in Fusion Reactor Blankets"; HMI-B202; Hahn-Meitner-Institut für Kernforschung: Berlin, Germany, 1977.
Gruber, J. Contaminant accumulation during transport through porous media, Water Resour. Res., 26, 99 - 107, 1990. (updated version)
Gruber, J.; J.O. Leckie "Importance of secondary repositories in solute transport through porous media, in: Am. Assoc. of Petroleum Geologists Research Conf. Prediction of Reservoir Qualitiy through Chemical Modeling, Park City, UT, U.S.A., 21. - 26. June, 1987.
Gruber, J. Models of Contaminant Migration: The Role of Chromatographic Models, 1996.
Gruber, J.; Schneider, J. "Transmutation und Aktivierung von Stainless Steel 316SS in einem thermischen Fusionsreaktor-Blanket"; HMI-B212; Hahn-Meitner-Institut für Kernforschung: Berlin, Germany, 1977.
Gruber, J.; Schneider, J.; Lehmann, B. "NUCCON - A Program for Calculating the Neutron Activation"; HMI-B312; Hahn-Meitner-Institut für Kernforschung: Berlin, Germany, 1979.
Gruber, J.; Schneider, J. "Hazardous Impurity Activity in Blanket Materials in 8th Symp. on Engineering Problems of Fusion Research: San Francisco, Calif., Nov. 13-16, 1979 (IEEE Pub.No. 79 Cll 1441-5 NPS).
Harter, T. Reference: Groundwater Quality and Groundwater Pollution, Farm Water Quality Planning (FWQP) Reference Sheet 11.2, Publication Number 8084, University of California at Davis, Division of Agriculture and Natural Resources, 2003 (in cache).
IAEA, Radiological Characterization of Shut Down Nuclear Reactors for Decommissioning Purposes, TECHNICAL REPORTS SERIES No. 389), 1998 (in cache).
ICRP-Publication 2 "Radiation Protection Recommendations of the International Commission on Radiological Protection"; Pergamon Press: Oxford, Great Britain, 1959.
ICRP-Publication 30, part 1 and 2 "Limits for Intakes of Radionuclides by Workers"; Pergamon Press: Oxford, Great Britain, 1978.
A free data source on the internet -used in these calculations- is 10 CFR Part 20 "Standards for protection against radiation", Appendix B - Radionuclide Table - Index of Radioisotopes.
Kabata-Pendias, A., Trace Elements in Soils and Plants, 4th ed., CRC Press, 2010.
Radiation Exposure: Data and Definitions.
Tucek, Kamil, Neutronic and Burnup Studies of Accelerator-driven Systems Dedicated to Nuclear Waste Transmutation, Doctoral Thesis, Royal Institute of Technology, Department of Physics, Stockholm 2004 (in cache).
O'Banion, K. Environ.Sci.Tech. 1981, 15(10), 1130-1136.
Ortoleva, P. et al. "Redox front propagation and banding modalitites", Physica, 19D, 334-354, 1986.
Seelmann-Eggebert, W. et al. "Nuklidkarte", Verlag Gersbach und Sohn, 8 M�nchen 34, Barer Str., Germany, 1974.
United States Nuclear Regulatory Commission, Appendix B (Annual Limits on Intake (ALIs) and Derived Air Concentrations (DACs) of Radionuclides for Occupational Exposure; Effluent Concentrations; Concentrations for Release to Sewerage) to NRC Regulations Title 10, Code of Federal Regulations (10 CFR) Part 20, Standards of protection against radiation (in cache), List of Radionuclides.
United States National Committee on Radiation Protection, Maximum Permissible Body Burdens and Maximum Permissible Concentrations
of Radionuclides in Air and in Water for Occupational Exposure, INIS-XA-N-339, National Bureau of Standards Handbook 69,
Issued June 5, 1959 (in cache).
Kessel, C.E., "The Fusion Nuclear Science Facility (FNSF), what is it and what challenges does it present?", VLT Highlights, August 27, 2014 (in cache).
Abdou, M., "Tritium Breeding in Fusion Reactors", p 293-312 in: Proceedings of the International Conference on Nuclear Data for Science and Technology, 6-10 September 1982, Antwerp, K.H. Böckhoff (ed.), ECSC, EEC, EAEC, Brussels and Luxembourg, 1983.
Sawan, M., "Introduction to Fusion Technology Issues", Lecture II: "In-Vessel Components: Blanket, Shield, Divertor", Fusion Technology Institute, University of Wisconsin, 14 August 2013 (in cache).
Cheng, E.T. and Smith, D.L., "Nuclear Data Needs and Status for Fusion Reactor Technology", pages 273 - 278 in:
Nuclear Data for Science and Technology: Proceedings of an International Conference held at the Forschungszentrum Jülich, Fed. Rep. of Germany, 13 - 17 May 1991, organized in Cooperation with OECD-Nuclear Energy Agency and International Atomic Energy Agency, Syed M. Qaim (ed.)
Login to Google to see more pages.
Broden, K., P. Rocco et al., Management of waste from the Internationl Thermonuclear Experimental reactor and from future fusion power plants, p.49-56 in: Fusion Technology 1996: Proc. of the 19th Symposium on Fusion Technology, Volume I, Lisbon, Portugal, 16-20 September 1996, Varandas, C, F. Serra (eds.), Elsevier, 1997.
APPENDIX
A.I Evaluations for Fusion Reactor Waste:
Mayor Elements and Impurities in First Wall, Neutron Multiplier and Neutron Moderator
Table 3. Data and Results of Activation Calculations
A.II Evaluations for Tritium from Fusion Reactors
A.II.1 Data
|
Radioisotope
|
Half Life T
yr
|
Ingestion Dose Coefficient
dspec (1)
rem/Ci (10-11 Sv/Bq)
|
Inventory
kg
|
Specific Activity S
Ci/g H3
|
| H3 |
12.3 |
64 (1.7)(*) |
1 |
1.4 104 (9.650 103)(*) |
Comment:
(1) based on a biological half life of 10 days.
(*) Nuclear Safety Data Sheet: Tritium - in cache
A II.2 Results
Caveat concerning the use of the specific activity concept
Tritiated water, i.e. the H2O-HTO molecular array, released from a fusion plant undergoes thorough isotopical dilution in environmental water up to a point in time when it has filled an area that might be called "effectively closed area". This is so large that the tritiated water might recycle between various hydrogen compartments rather than leave the area. The following evaluation in terms of tolerable environmental tritiated water concentration cp (units: g of tritiated water per liter of environmental biosphere water) is based on the specific activity concept. It can only be useful as a guide when applied to an effectively closed area.
This impact assessment is incomplete in the sense that it will not provide any estimates of "effectively closed area" sizes.
Comment:
(1) The tritium inventory has been evenly distributed in 10 m3 of blanket material
A.II.3 Method of Calculation
Tritium inventory in blanket, MH3:
MH3 = 1 kg
Tritium activity per mol of H3, tpm:
tpm = NA ln2 / T
where T = 12.3 yr
Total H3 inventory in blanket, Q
Q = tpm / (3 g/mol) MH3
Population dose of inventory MH3, dmax:
dmax = Q dspec
Biological Hazard Potential of inventory MH3, BHP:
BHP = Q dspec
and biological hazard potential of 1 cm3 of blanket material (assumed tritiated volume of blanket material: 10 m3), bhp:
bhp = BHP/(10 m3)
The specific activity of tritiated water, HTO, is
S = tpm / M,
where M (molecular weight of HTO) = 20 g,
S = 1.4 103 Ci/(g HTO).
The concentration limit is defined as
cp = (0.5 rem/V) 1/(S dspec).
With the ingestion dose coefficient dspec = 64 rem/Ci it follows that
cp = 7 10-9 g HTO per liter of environmental water
A.III Evaluation for Selected Actinides from Fission Reactors
A.III.1 Data
|
Actinide
|
Half Life T
yr
|
Ingestion Dose Coefficient
dspec, (1)
105 rem/Ci (10-8
Sv/Bq)
|
Inventory cOR
mole/tHM
|
Specific Activity S
Ci/g
|
| Am243 |
7.4 103 |
7.4 (20) |
0.24 |
2.0 10-1 |
| Pu239 |
2.4 104 |
9.25 (25) |
21.4 |
6.2 10-2 |
| Np237 |
2.1 106 |
4.1 (11) |
1.74 |
7.0 10-4 |
| Pu242 |
3.7 105 |
8.9 (24) |
1.05 |
3.9 10-3 |
Comment:
(1) after EURATOM Council Directive
A III.2 Results
A.III.3 Method of Calculation
A.III.3.1 Inventory
-
The concentration COR (unit: moles per ton of heavy metal, moles/tHM) of any radioisotope has been calculated with ORIGEN for a fuel burn-up of 30 GWthd/tHM
-
The activity Q' is calculated from COR
Q' = COR NA ln2/T
where the unit of Q' is Bq/tHM when the unit of T is sec. (Conversion from Bq to Ci: 1 Ci = 3.7 1010 Bq)
The activity per cm3 of fission reactor fuel is
q = Q'/VHM
where the volume of 1 ton of heavy metal is VHM = 5.3 104 cm3/tHM
-
The population dose dosemax inflicted by the total inventories Q = (Q' charge) of the mentioned actinides is
dosemax = dspec Q' charge
- dspec = ingestion dose coefficient:
EURATOM council directive 96 specifies the specific doses dspec of these actinides (see Table "Data").
- charge = weight of fission reactor fuel that produced 1 GWth yr:
charge = 1 GWth yr / (30 GWth d / tHM) = 12.2 tHM
-
Following the definition given above, the biological hazard potential BHP of fission reactor fuel inventory Q due to the actinides is
BHP = V / (0.5 rem) dosemax
and the biological hazard potential due to the actinides contained in 1 cm3 of fission reactor fuel is
bhp = BHP/(charge VHM)
A.III.3.2 Concentration Limits in Biosphere Water Bodies
The above given definition of the concentration limit cp of a radioactive element in water of the biosphere environment is
cp = 0.1 MPC / S,
where
S for non stable elements has been defined above (the actual values have been entered into the last column of the Data Table)
0.1 MPC = permissible actinide intake / V
permissible actinide intake = 0.5 rem / dspec.
Substituting these in the definition of cp, we find for the concentration limit in biosphere water
cp = 0.5 rem/ (V dspec S)
The resulting concentration limits cp have been entered into the last column of the Results table.
Last Changed: September 30, 2017
Location (URL) of this paper
Home
Joachim Gruber